The calculus of the batting average
The batting average is a misleading indicator. How about a scale that is more representative of batting performance?
Kartikeya Date
29-May-2014
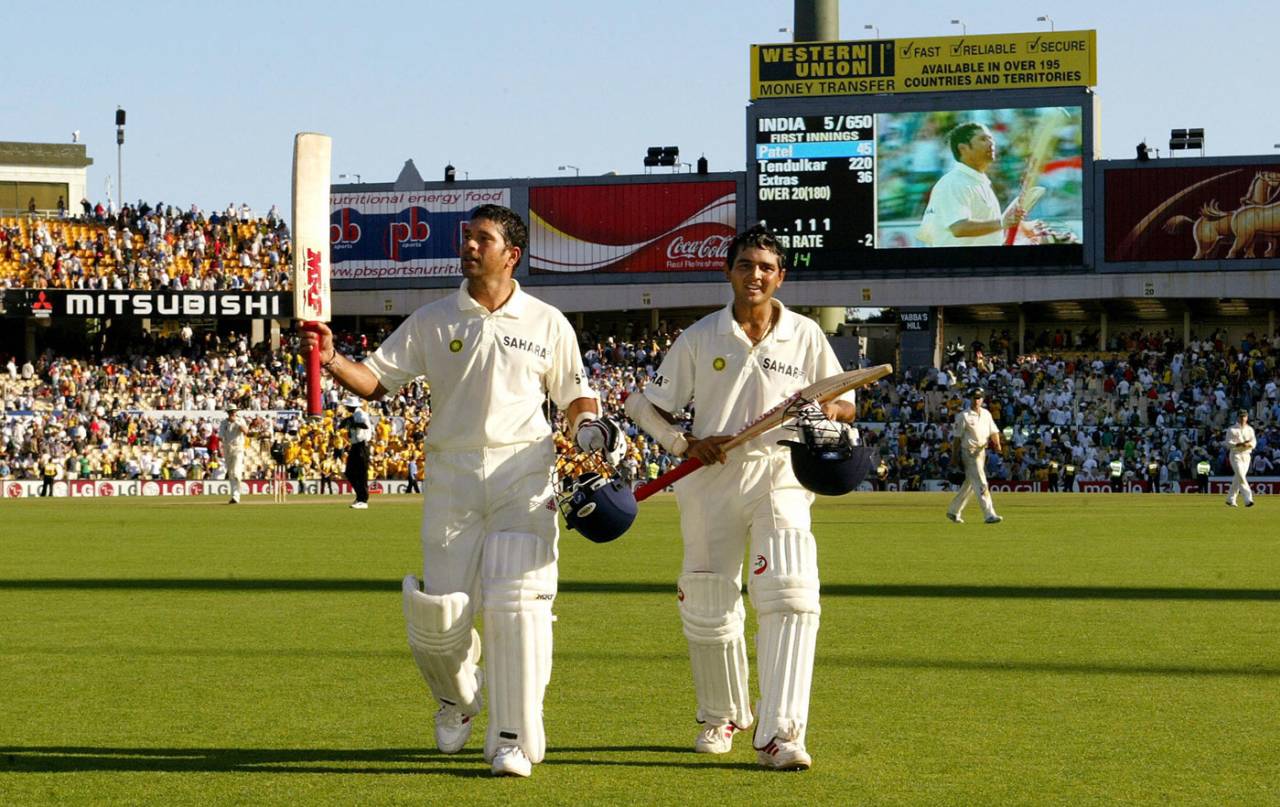
In the 2003-04 season, Sachin Tendulkar averaged 54.91 in 15 innings. But his score for the period is 28 • Getty Images
The batting average in cricket is the number of runs made by a player per dismissal. Not-outs inflate averages. To get a sense of the extent of this problem, compare the records of Brian Lara and Steve Waugh. The former had six not-outs in 232 Test innings. The latter had 46 in 260. Lara batted most frequently at No. 4, and had one not-out in 148 innings at that position. Waugh batted most frequently at No. 5, and had 22 not-outs in 142 innings there. This makes it basically meaningless to compare the batting averages of Waugh and Lara. Yet this is commonly done with Test batsmen.
Team success also affects the likelihood of not-outs. In wins, batsmen remain not out about 15% of the time. In defeats, this drops to about 9%. To some extent, this explains why Lara remained not out at a rate well below the average for a No. 4, while Waugh remained not out at a rate well above the average for No. 5. At the very least, this basic fact about the different rates for not-outs depending on batting position illustrates the limits of comparing an opener's batting average to that of a middle-order batsman. A look at batting in Test cricket by batting position shows that the problem is systematic.
The average also does not indicate how many runs a player is likely to score in a given innings. The median innings in Test cricket produces 13 runs. The median Test innings for Lara is 34, while for Waugh it is 26. As a descriptor of a batsman's record, the average is a limited measure.
I propose a different measure for a batsman's quality and consistency. This measure is in the form of a scale.
Consider the first 100 runs made by a batsman. The chart above shows the probability of a batsman (with at least 2000 career runs) reaching any score from 1 to 100. Two hundred and seventy-five batsmen have scored at least 2000 Test runs, from Dilip Sardesai with 2001 to Sachin Tendulkar with 15,921. These batsmen have played a combined 32,409 innings. They score a century nine times in 100 innings. They reach double figures 71 times out of 100. A batsman's batting score can be given simply by calculating the area under this curve.
Here is a simple example to illustrate the difference between the score and the batting average. In the 2003-04 season, Tendulkar made 659 runs at 54.91 in nine Tests and 15 innings. The distribution of scores over 15 innings was peculiar, though: 495 of the 659 runs came in three innings, each not out. Tendulkar's median score over those 15 innings was 8. In these 15 innings, Tendulkar reached 100 twice, 60 thrice, 37 six times, 8 eight times and 1 13 times. His score over those 15 innings is 28.
The score provides a more representative picture of Tendulkar's performance that season compared to his batting average. To get a sense of how low a score of 28 is, the batting average for the 275 batsmen who made at least 2000 Test runs is 41; their collective score is 34.
It is a matter of some surprise that this method of measurement has not been used yet in cricket. Even the basic idea of measuring runs per innings, instead of runs per dismissal, has gained little currency. The method described in this post could be extended by using a different upper limit, say 150 or 200, or even 400 (the current highest Test score). With an upper limit of 400 it would simply provide the runs per innings (total runs divided by total innings).
I think it is a bad idea to use an upper limit greater than 100 if the goal is to measure consistency of contributions. A single innings of 400 not out can only win or save one Test match, while eight innings of 50 might help your team compete in four or more Test matches. The series in which Lara made his 400 not out (series batting average 83.33), and the one in which he made his 375 (series batting average 99.75) illustrate this point. In the former, his score is 29, in the latter, it is 57. I would argue that the score captures Lara's performance in each series better than the batting average does.
In summary, I prefer the use of the score over the batting average, because the former accounts for events that occur frequently, while the latter is disproportionately affected by events that occur only rarely. As an illustration of the power of this measure, consider all the batsmen with a score of 41. There are 13 such players and they range from Wally Hammond (average 58.45) to Rohan Kanhai (average 47.53). Kanhai and Hammond were basically equally consistent in Test cricket.
Note: In the tables that follow, each score and average is rounded to the nearest integer.
Kartikeya Date writes at A Cricketing View and tweets here