Mining control statistics
What can data based on the control batsmen have over their shots tell you about innings and results?
Kartikeya Date
10-Jun-2014
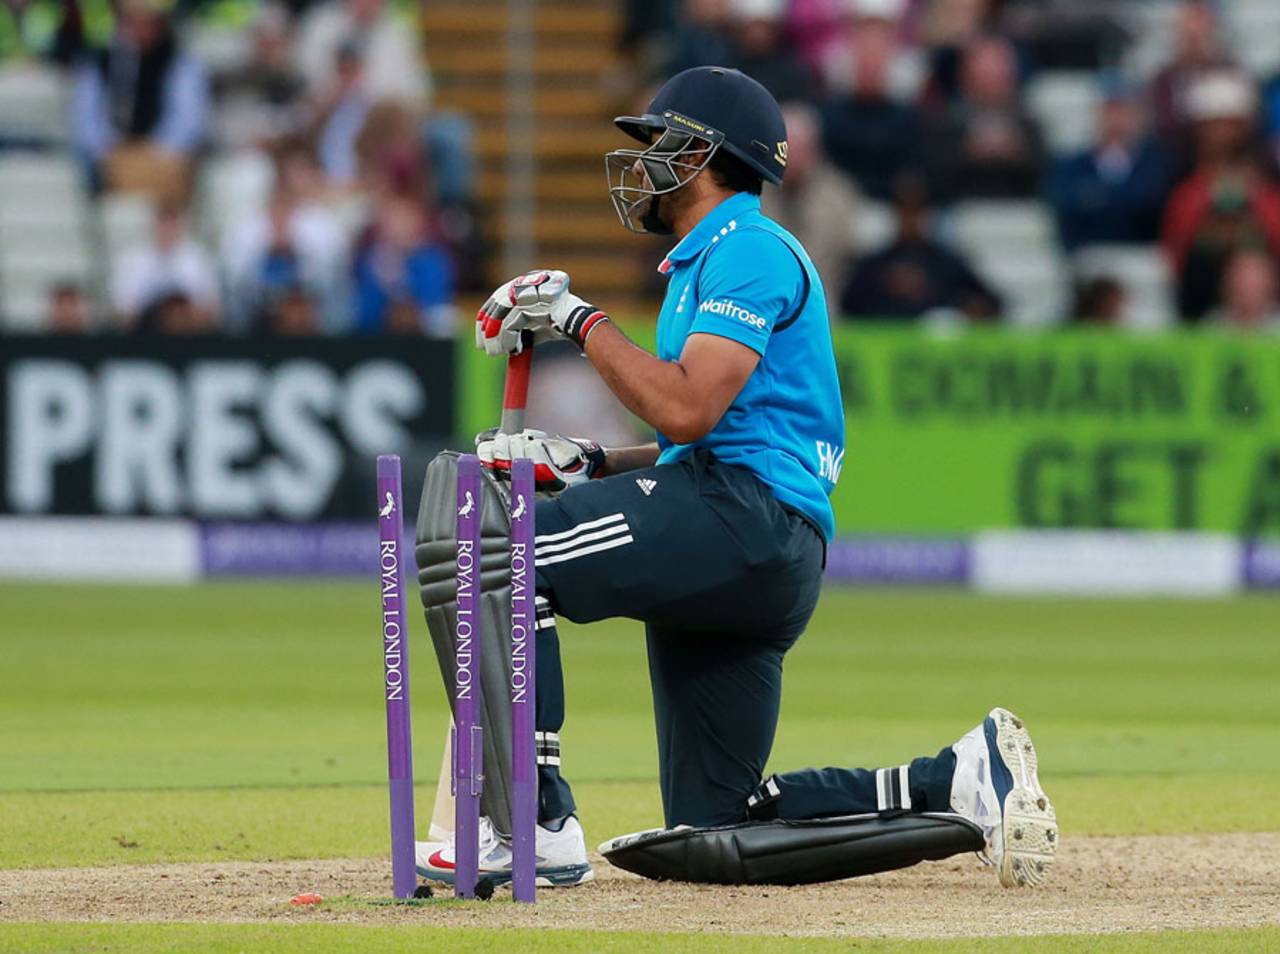
Experts said Ravi Bopara was unlucky to be dismissed while trying to sweep, but the stats suggest otherwise • PA Photos
It used to be that following a Test match without being able to watch it meant listening to radio commentary or live online commentary. These days, games in progress are described using increasingly sophisticated and detailed statistical measures. Many of these are available on TV as well. ESPNcricinfo's record of cricket matches allows us to paint a picture of a game in progress (or a recent game) beyond the edited packages provided by television highlights. While games are in progress, one can look up a wide range of records, from wagon wheels, to over comparisons, to player-v-player records, to partnership records, instead of relying on the largesse of the director of the broadcast and the whims of live commentators.
Recently, ESPNcricinfo expanded the range of statistics it offers for each game. It now records intentions, using the "Control" statistic. Control is basically a measure of whether or not the ball went where the batsman intended it to go. This is determined based on where the ball hit the bat, whether or not it was mistimed, and whether or not the batsman played at the ball*. It is recorded by the reporters who do the live ball-by-ball data entry and is a binary measure. A batsman is either in Control or not in Control for each delivery.
The example below shows this metric for Ravi Bopara's half-century in England's chase against Sri Lanka at Lord's. The measure reveals his troubles against Ajantha Mendis. A look at the commentary for this innings tells us that Bopara aimed sweep shots five times in 13 deliveries against Mendis, connected once, and was dismissed while attempting the shot. It also tells us that Bopara did not have similar troubles with Sri Lanka's other spinner Sachithra Senanayake. All these points lead one to the possibility that Bopara wasn't reading Mendis from the hand. I happened to watch a part of the post-match review by Ian Botham, who said that Bopara was unlucky to be dismissed the way he was. The data suggests that he was perhaps lucky to survive as long as he did, and even connected with a sweep shot once. This isn't as good as watching the game, but if you couldn't watch, this type of reconstruction would be the next best thing.
The Control measure has been recorded for at least the 2011, 2012 and 2013 seasons of the IPL. It is essential to understanding how the T20 game works. I'll introduce it in a few charts I built based on this data.
Scores in the IPL range from 0 to 175, but the overwhelming majority of scores are less than 100. The highest number of deliveries faced by a batsman in a T20 game is 66 (by Chris Gayle when he scored 175). My first chart shows the average control measure for each score in the IPL. As one would expect, this measure is lower in very low scores. For example, if a batsman made 6 in five balls, and made exactly one mistake, his Control measure would be 80%. If a batsman made 60 in 50 balls and made exactly one mistake (an unlikely event in any cricket, let alone T20), the Control measure for this innings would be 98% (49/50 in control). In the IPL as a whole, the control figures have remained steady between 73% and 75% for the 2011, 2012 and 2013 seasons. There is some evidence to suggest that this figure may be closer to 70% for 2014, but data for all games is not available yet. In the 2014 IPL final, King's XI Punjab had a combined Control of 59%, while the winning Kolkata Knight Riders achieved a Control of 68%.
In my next chart, I look at Control over the length of individual T20 innings. The chart confirms two expectations. First, that strike rates improve as T20 batsmen survive more deliveries. Second, that Control improves but at a slower rate and settles at a level somewhere between 70 and 80. If we look at individual IPL innings that last at least ten balls, the Control measure basically settles to a level between 75% and 80% for the best strike rates.
| Strike rate | Control | Number of innings |
| Less than 100 | 72% | 638 |
| 100 to 124 | 74% | 641 |
| 125 to 149 | 77% | 503 |
| 150 or more | 77% | 502 |
Finally, let's look at how Control correlates to results. Do winning teams demonstrate higher net Control than losing teams? Net Control is simply the Control achieved by a batting team minus the Control achieved by opposition batsmen against its bowlers. In my final chart for this post, I look at the net Control achieved by each IPL side in each season. There is a weak trend showing higher net control for greater success. To understand just how weak this is, the 2013 Chennai Super Kings achieved batting Control of 79%, while opposing batsmen achieved Control of 74% against their bowlers. This basically means that over a 20-over innings, Chennai Super Kings batsmen miscued (or missed) 25 times, or basically had control over 95 of the 120 deliveries they faced. Opposing batsmen had control over 89 out of 120 deliveries they faced. No IPL team has achieved a batting Control measure of more than 95 balls per 20 overs (79%). The most commonly achieved batting Control by a team over 120 balls is 89 and 90. The 2014 IPL final, hailed by some as the best IPL final to date, saw the winning side in Control for 82 out 120 deliveries, and the losing side in Control for 71 out of 120. The Net Control for KKR was +11. Over the course of a season, these are the Net Control measures achieved by each team.
I'll end with some simple arithmetic. Given that we know that about seven wickets fall in 20 overs in T20, if we assume that each dismissal is the result of a batsman not being in Control (a generous assumption, since a number of dismissals occur off the middle of the bat in the IPL), we can assume that batsmen miss or miscue 31 times out of 120 on average, are dismissed seven times out of 31. The actual figure is likely to be lower, closer to six out of 31, since some of the dismissals are run-outs. This gives you some sense of the nature of batting risk in a 20-over game in which there aren't too many catching men, and fields are set not to dismiss batsmen when they make mistakes but to protect runs.
If you were making a choice about whether or not to take a chance while knowing that if the chance didn't come off, you would pay a huge price (being dismissed, in the case of a batsman), but that it was likely that your gamble would pay off four out of five times, would you take it? Batsmen in the IPL do.
As a contrast to these figures for Control in the 20-over game, Kumar Sangakkara was in control 90% of the time in his recent century at Lord's. Jos Butler was in control 87% of the time in his century during England's chase in the same game.
* Also discussed via email communication with S Rajesh. ESPNcricinfo's stats editor. My thanks to him for sharing the Control data and explaining how it is recorded.
Kartikeya Date writes at A Cricketing View and tweets here