Match-by-match analysis of control data
How much would individual batsmen score if they batted all 20 overs by themselves, and how frequently would they be in control?
Kartikeya Date
22-Jun-2014
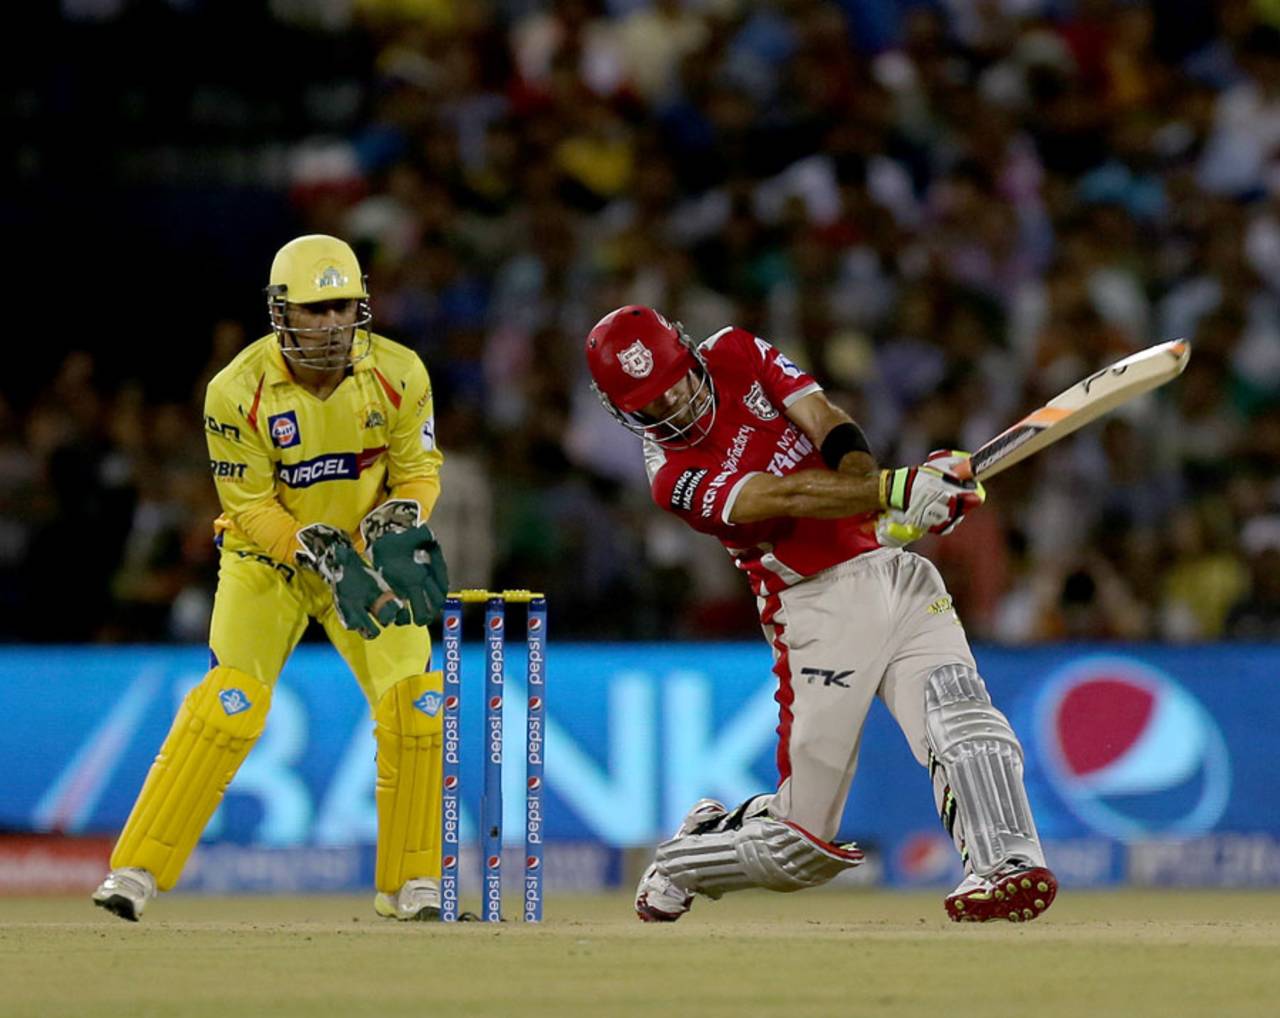
Glenn Maxwell would score 215 runs if he had 20 overs to himself in a T20 • BCCI
In my last piece I discussed ESPNcricinfo's "Control" measure. During commentary, the site's ball-by-ball commentators and data-entry operators record whether or not a batsman is "in control" or "not in control" for each delivery.
The records for the 2011, 2012 and 2013 editions of the IPL show that batsmen are in control about 75% of the time in T20. Batsmen are dismissed once for every five times that they miss or miscue the ball. Over the course of a single IPL season, the highest Control measure recorded by a team is 79% (or 95/120 balls faced).
In this post, I will look at how Control correlates with results on a match-by-match basis. I will also look at individual batsmen in the IPL and the control measures they have achieved. For convenience, I will consistently give the Control measure per 120 balls, for both individual batsmen and teams. Whenever I refer to the IPL in the remainder of this post, I am referring to the 2011, 2012 and 2013 editions of the league.
Overall, Control for winning teams was 91, for losing teams 87. There is no significant correlation between Control and the likelihood of victory. It is generally true across IPL teams that winners are in control slightly more than losing teams. No single team stands out in this regard.
| Team | Overall | In losses | In wins |
| Chennai Super Kings | 93 | 88 | 95 |
| Deccan Chargers | 89 | 88 | 92 |
| Delhi Daredevils | 87 | 83 | 92 |
| Kings XI Punjab | 86 | 85 | 88 |
| Kolkata Knight Riders | 89 | 90 | 88* |
| Mumbai Indians | 88 | 85 | 90 |
| Pune Warriors | 88 | 88 | 88 |
| Rajasthan Royals | 90 | 87 | 93 |
| Royal Challengers Bangalore | 89 | 84 | 92 |
| Sunrisers Hyderabad | 90 | 93 | 88 |
| Team | Overall | In losses | In wins |
| Chennai Super Kings | 88 | 89 | 88 |
| Deccan Chargers | 88 | 91 | 83 |
| Delhi Daredevils | 88 | 88 | 88 |
| Kings XI Punjab | 88 | 90 | 86 |
| Kolkata Knight Riders | 90 | 93 | 88 |
| Mumbai Indians | 88 | 91 | 86 |
| Pune Warriors | 92 | 92 | 90 |
| Rajasthan Royals | 88 | 89 | 87 |
| Royal Challengers Bangalore | 88 | 92 | 85 |
| Sunrisers Hyderabad | 88 | 96 | 82 |
Consider the fact that the major playing conditions in the IPL have remained consistent over these three seasons, the quality of players has remained consistent, the games have been played on the same grounds, and the rules for team composition have not changed. It makes sense that this measure should be fairly consistent across teams. This ought to make us more confident about the quality of the data. Keeping track of whether or not a player was in Control or not (using a good definition of each) ball by ball can bring in many different types of errors. The overall measure for Control has remained consistent for each season. All in all, the data suggests that the definition used to specify "In Control" and "Not in Control" is reasonably easy to apply despite the fact that a number of different ball-by-ball commentators must have built the database over the years. Any error, such as it might be, in this Control measure is likely to be systematic rather than random.
The weak trend showing higher Control for winning teams (by about four deliveries per 120, 91-87) should be seen as a symptom rather than a cause. It is not significantly the case, in my view, that teams that middle the ball more win, or that teams that make better choices at the batting crease win more often. Rather, it is likely to be that teams that are in winning positions find themselves in situations where they get a few cheap runs and some bad balls.
The three biggest scoring franchises over these years are Chennai Super Kings, Royal Challengers Bangalore and Kings XI Punjab. They average 154-156 runs per 20 overs with the bat. Their Control with the bat spans the range of measures for teams - 86 for Kings XI, 89 for Royal Challengers and 93 for Super Kings.
Now that there is some reason to view the Control measure with confidence, let's look briefly at individual batsmen. While the Control measure does not tell us much about team performances, it does differentiate individual batsmen. There are those who are eager to swing, while there are others who cannot bring themselves to do so. Some are better than others. The chart that follows is based on the two tables attached at the end of this post. It shows all batsmen who have scored at least 400 runs in the IPL. All figures in these charts are calculated per 120 deliveries.
The world of IPL has two outliers. Glenn Maxwell and Paul Valthaty. If Maxwell batted for 20 overs all by himself, he would score 215. These would include 45 misses or miscues. If Valthaty batted 20 overs all by himself, he would score 147, and miscue or miss about 52 deliveries.
Most IPL batsmen would miss or miscue about 30-35 deliveries if they were to bat the 20 overs all by themselves. Valthaty is about 50% worse.
Five other batsmen stand out in this measurement. Virender Sehwag, Chris Gayle, MS Dhoni, AB de Villiers and David Miller would all score more than 180 runs in 20 overs of batting. Gayle would make three out of four runs in boundary hits. Sehwag would make seven out of ten runs in boundary hits. For the other three, the ratio is about two out of five. They would be in Control for about 86 (for Sehwag) to 94 (for Dhoni) deliveries.
If any of the other batsmen in the IPL were to bat 20 overs all by themselves, they would score somewhere between 128 and 166 runs, while staying in Control of the ball for somewhere between 80 and 97 deliveries. Jacques Kallis would make 128 runs in 20 overs, but he would be in Control 97 out of 120 deliveries. He would make 64 runs in boundaries and 64 by running between the wickets. Saurabh Tiwary, once a fringe member of India's limited-overs side on the back of his IPL performances, would make 126 runs and would be in Control for 93 deliveries in 120. At the other end of the scale, one of India's limited-overs mainstays at least in the subcontinent, Suresh Raina, would make an impressive 166 while remaining in complete control on 95 of 120 deliveries.
In his 38th, 39th year and 40th years, Sachin Tendulkar would have made 139 runs while remaining in Control three out four deliveries. In this decidedly average avatar of the game, Tendulkar was quite literally the average performer.
03:22:45 GMT, 24 June 2014: In the first table, Kolkata Knight Riders' Control figure was stated to be 98, not 88. This has been corrected.
Kartikeya Date writes at A Cricketing View and tweets here