The bat-first advantage in the Powerplay era
The batting Powerplay might be history, but it's worth reviewing how those restrictions loaded the odds in favour of batsmen batting late in the first innings of ODIs
Kartikeya Date
21-Jul-2015
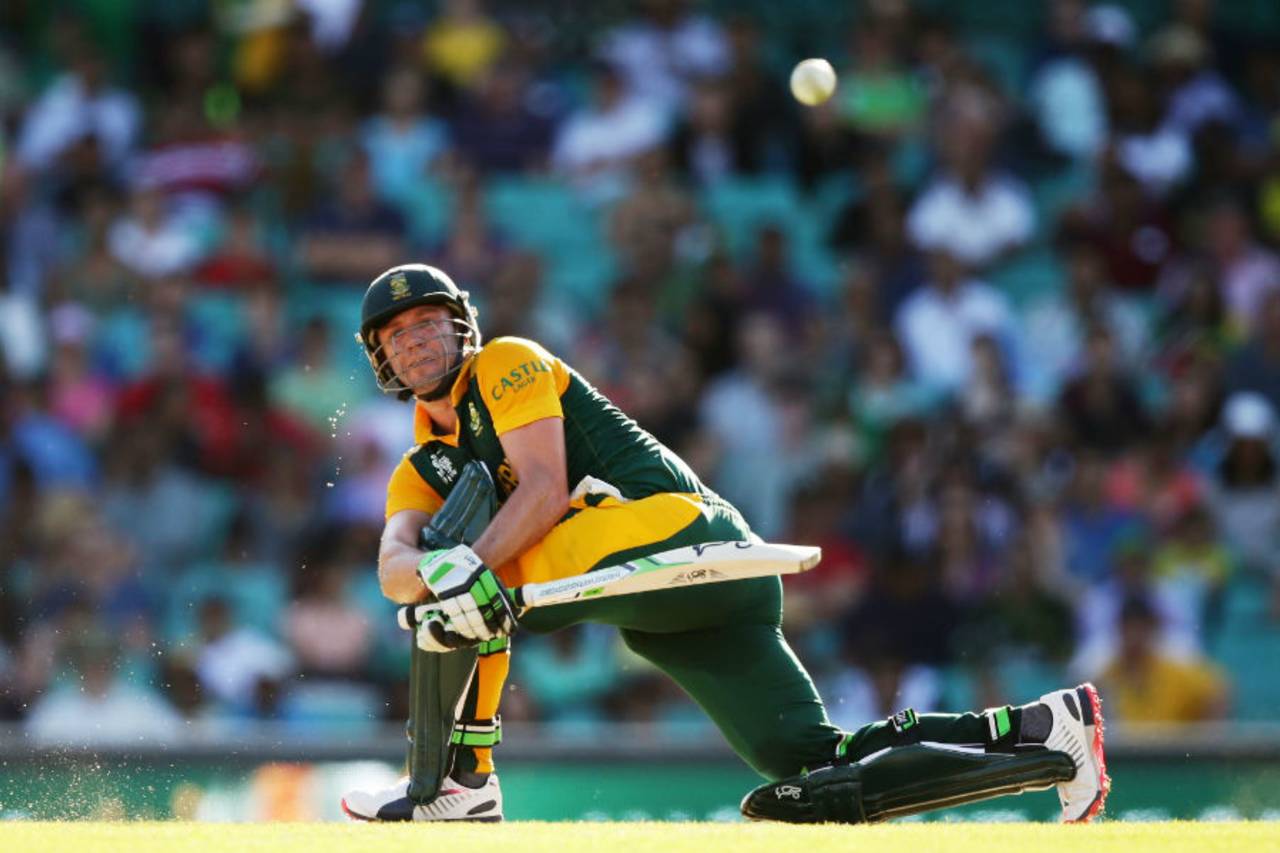
AB de Villiers has some fine innings in chases since November 2012, but even such brilliance has not always made a difference to South Africa • Getty Images
Beyond much dispute, AB de Villiers (strike rate 112, average 64) has been the best limited-overs player in the world since the ODI rules were changed in late October 2012. But there is a peculiarity in his record. Here are some scores he made in unsuccessful chases since November 1, 2012: 80 in 76 against Australia in Perth, 70 in 71 against India in Cardiff, 77 in 58 and 74 in 45 against Pakistan in Port Elizabeth and Auckland respectively, 52 in 34 against Australia in Canberra, 51 in 51 against Sri Lanka in Colombo. In 19 run chases, de Villiers made one century and nine half-centuries - an astonishing return, but South Africa lost 13 of those 19 games.
Of the ten times that de Villiers reached 50 in chases, he was dismissed before reaching a century six times. On three other occasions he scored at a run a ball or less and remained undefeated. South Africa lost every single time when he was dismissed between 50 and 100. In the first innings, he reached 50 on 14 occasions, and converted these innings to centuries six times - often in spectacular fashion.
It could be argued that this is a glitch in his record - this weakness in the chase where his judgement failed him often enough for him to be dismissed with his team short of victory.
Meanwhile Virat Kohli has done far better in chases than when batting first. Kohli was bucking a broader trend, though. The rules in 2012 systematically favoured the team batting first in ODIs. By doing so, they also systematically made close finishes less likely.
In this post, batting patterns in matches involving the top eight Test teams (the Full Members excluding Bangladesh and Zimbabwe) have been considered, and ODI cricket has been divided into three periods. The first includes the four years leading up to July 8, 2005, when the Powerplay first made an appearance in ODIs. The second is from July 8, 2005, to October 29, 2012, when 20 out of 50 overs had fielding restrictions in one form or another. The third is from October 30, 2012, when the restrictions for the non-Powerplay overs were changed and the Powerplay overs were reduced to 15. (The ICC has changed the rules again this year, removing the batting Powerplay altogether.)
Setting and chasing targets have always been distinct pursuits in ODI cricket. The "finisher" in limited-overs folklore is a creature of the chase. How many of you remember a memorable finish to the first innings of an ODI by MS Dhoni or Michael Bevan? When he became captain, Rahul Dravid decided to tackle India's problem with chases head on, and chose to bowl first at every available opportunity. India become so good at chases that they established a world record of consecutive successful chases. Teams constantly fret about what the conditions will be under lights, since most limited-overs cricket in recent years has the added variation of the chase taking place under lights. Will the dew liven things up for the pacemen? Or will it hamper fielding and soften the ball up?
The percentage of individual ODI scores of at least 50 in seven scoring-rate brackets (less than 50, 50-74, 75-99 runs per 100 balls and so on) in the first and second innings remained the same in the periods 2001-05 and 2005-12, as the following graphs show.
In the 2012-15 period, not only has the percentage of innings where the strike rate is at least 100 increased from about 29% to 45%, but the distribution of scoring rates in first and second innings has diverged. Scores of at least 50 have been made slower in chases than they have when batting first.
This disparity also appears in the rates at which centuries have been scored. Given the general increase in scoring rates, some basic increase in the rate of century (and half-century) scores is to be expected. Of all individual ODI innings in 2001-05, 14.5% were at least 50s. From 2012-15, this has increased to 16.5%. This increase is found disproportionately in the first innings of matches. Conversion rates from 50 to 100 in the first innings increased from 19% in 2001-05 to 29% in 2005-12. The increase in conversion rates in the second innings was less dramatic - from 16% to 19%.
| Period | Innings in match | No. of innings | 50s | 100s | 50s % | 100s % |
| 2001-05 (A) | 1 & 2 | 5943 | 715.00 | 151.00 | 12.00 | 2.50 |
| 2001-05 (A) | 1 | 3148 | 393.00 | 90.00 | 12.50 | 2.90 |
| 2001-05 (A) | 2 | 2795 | 322.00 | 61.00 | 11.50 | 2.20 |
| 2005-12 (B) | 1 & 2 | 10411 | 1397.00 | 268.00 | 13.40 | 2.60 |
| 2005-12 (B) | 1 | 5570 | 766.00 | 160.00 | 13.80 | 2.90 |
| 2005-12 (B) | 2 | 4841 | 631.00 | 108.00 | 13.20 | 2.20 |
| 2012-15 (C) | 1 & 2 | 3718 | 465.00 | 145.00 | 12.50 | 3.90 |
| 2012-15 (C) | 1 | 1930 | 234.00 | 96.00 | 12.10 | 5.00 |
| 2012-15 (C) | 2 | 1788 | 211.00 | 49.00 | 11.80 | 2.70 |
Individual batsmen did far better batting first than they did batting second under the 2012 rules than they did under the 2005 rules or the ones before then. The large total has itself been reimagined. A remarkable 59 out of 210 first innings under the 2012 rules produced at least 300 runs. Three hundred may not yet be the par score that the commentators tell us it is, but it is unquestionably more commonplace than it used to be. Chasing teams were put under more pressure than ever before, and not surprisingly, under the 2012 rules, chasing teams were bowled out more often than at any time in the past.
| Period | Team batting first bowled out, and won | Team batting second bowled out, out of all second innings | Team batting first not bowled out, and won | Team batting second not bowled out, and won |
| 2001-05 (A) | 20/94 (21%) | 116/324 (36%) | 140/241 (58%) | 160/208 (77%) |
| 2005-12 (B) | 36/184 (20%) | 215/576 (37%) | 224/395 (57%) | 301/351 (86%) |
| 2012-15 (C) | 9/62 (15%) | 87/204 (43%) | 93/142 (65%) | 95/113 (84%) |
Over 12 years, from 2001 to 2012, in 910 games across two different sets of Powerplay rules, batting first and using up all 50 overs meant winning about 57% of the time in 2001-12. Since 2012, it has meant winning 65% of the time. Batting first and getting bowled out meant losing about 80% of the time in 2001-12. Since 2012, it has meant losing 85% of the time. Teams that haven't been bowled out in chases have also won more frequently. Consequently, teams have been getting bowled out more often in chases since 2012 (43% of innings). The rate at which teams have been getting bowled out batting first has remained the same.
The story so far is that individual batsmen and teams batting first have systematically benefited from the rules of ODI cricket as revised in 2012. In what part of the innings has this benefit accrued? After all, the whole point of the Powerplay was to minimise periods of stalemate (the so-called "middle-overs problem").
Consider the 400-run first-innings total. This has been achieved eight times against the top eight Test-playing teams. Australia did it first, in 2006 in Johannesburg. In that innings they reached 209 for 1 after 30 overs and 301 for 2 after 40. India have made 400 four times against such top teams. In Rajkot in 2009, they reached 261 for 1 after 30 overs and 335 for 4 after 40. Despite this small collapse, they made 414 for 7. In Gwalior in 2010, against Dale Steyn and Co, India reached 198 for 1 after 30 and 286 for 2 after 40. When Virender Sehwag bludgeoned West Indies for a double in Indore in 2011, India reached 225 for 1 after 30 and 311 for 1 after 40.
The first time 400 was crossed under the 2012 rules was by India at Eden Gardens in November 2014. They reached 169 for 2 after 30 and 275 for 3 after 40. When de Villiers, Hashim Amla and Rilee Rossouw all made hundreds against West Indies in a total of 418 for 5, South Africa were 172 for 0 after 30 and 276 for 1 after 40. De Villiers also destroyed West Indies in Sydney in the World Cup. This time, South Africa were 147 for 3 after 30 and 258 for 3 after 40. Finally, England did it against New Zealand at Edgbaston in June 2015. They reached 208 for 6 after 30 and 288 for 6 after 40.
You may have sensed a pattern here. Under the 2012 rules, totals of 400 or more (and indeed other huge totals between, say, 330 and 399) were achieved through a seemingly effortless shift in gears in the last 20 overs, which produced about 200 runs. The early 400 totals were made with significant impetus from the first half of the innings: more than half the runs were scored in the first 30 overs. In contrast, when he made his world-record 264 at Eden Gardens, Rohit Sharma took a leisurely 72 balls over his first 51 runs. India made 235 runs in their last 20 overs that day.
These outrageous scoring rates in the second half of the first innings of ODIs have become quite systematic: with wickets in hand, large scores can be built in the second halves of the first innings.
| Average runs, wickets for… | 2001-05 (runs, wickets) | 2005-2012 (runs, wickets) | 2012-15 (runs, wickets) |
| 1st innings | 261, 8.3 | 270, 8.7 | 289, 8.4 |
| 2nd innings | 245, 8.8 | 256, 8.9 | 267, 9.8 |
| 1st innings, overs 1-30 | 142, 3.75 | 147, 3.75 | 148, 3.51 |
| 1st innings, overs 31-50 | 118, 4.55 | 123, 5 | 141, 4.91 |
| 2nd innings, overs 1-30 | 138, 3.88 | 143, 4.03 | 146, 4.31 |
| 2ns innings, overs 31-50 | 108, 4.88 | 113, 4.89 | 121, 5.50 |
Teams seem to sit back in the first 30 overs more than they used to. The explosion in scoring lies entirely in the final 20 overs of the first innings of limited-overs games.
Have scoring patterns changed? Are de Villiers and Rohit and Jos Buttler scoring their runs differently from how players did in the mid-2000s? It turns out that they are not. Setting totals and chasing them remain very different things. Chasing teams play out more dot balls and score fewer singles than teams batting first. Interestingly, despite the fact that there have been more overs with field restrictions since 2005, the number of dot balls has declined. The number of singles has also declined, but boundary-hitting, especially six-hitting, has exploded.
Still, setting and chasing totals retain their individual rhythms. The start of the match usually sees a flurry of runs before teams settle down to play the middle overs and prepare for the slog. Chasing teams usually begin cautiously, and then try to keep up with the scoring rate. De Villiers has the luxury of picking his moment to attack when South Africa bat first. When they chase, even de Villiers is not brave enough to allow the asking rate to climb from 6.5 to 9 an over before beginning an assault. He has to keep taking risks, and keep the required rate within reach (albeit probably not at 6.5 all the way through). In the 2015 World Cup semi-final, had India batted first, Kohli would probably have seen that spell from Mitchell Johnson off and not taken the chance he did. But faced with 330, this was not an option; the risk had to be taken.
Not surprisingly, these facts have dictated the types of teams that are being picked. After India lost that World Cup semi-final, MS Dhoni observed that India lacked Australia's hitting power in the late order. Glenn Maxwell, Shane Watson, James Faulkner, Brad Haddin and even Johnson are all capable of mauling the bowling in inventive ways. This emphasis on late-order hitting is not a surprise when you consider what is possible in the second half of the first innings in ODIs. England demonstrated the value of late-order depth to great effect against New Zealand at Edgbaston this summer. In a chase, though, it's doubtful if England or any other team could have scored 180 runs in the final 20 overs after being five or six down.
Players who played in the old days, when the white ball would get discoloured and soft and offer reverse swing instead of flying off the bat in the 40th over, often argue that the use of two balls has contributed greatly to the explosion in scoring rates. This is perhaps true, but it doesn't explain why this explosion has been so much more pronounced in the first innings than in the second. The real reason may lie in the field restrictions. Five fielders inside the circle invite batsmen to loft the ball or hit narrower gaps in the field. When batting first without the pressure of a target, this is an opportunity. If the boundary is not found for a couple of overs, it does not really matter. When chasing, it does matter, and this is when the extra fielder in the circle becomes a burden rather than a scoring opportunity.
While it is clear that the 2012 rules systematically favoured teams batting first, their most damaging consequence was that they made close games systematically less likely. The median margin of victory for a team batting first has increased from 46 runs in the 2001-05 period to 73 runs since 2012.
Currently the ICC cricket committee's view seems to be that the extra fielder in the ring during the slog is the problem. But perhaps the time has come for the ICC to change its view on the original holy grail of limited-overs cricket: the quota of overs per bowler. Two ideas come to mind. First, increase the quota per bowler from ten to 12. This will not eliminate the fifth bowler entirely, but it will give fielding captains more room to account for a bowler who might be having an off day. Alternatively, give a bowler who takes a wicket one extra over. This will provide teams with an incentive to chase wickets in the middle overs. This is the real core of the ODI rules problem - that teams don't seek to take wickets.
The decision to eliminate the Powerplay and give bowlers extra cover in the final 10 overs is a good start. One suspects that a set of rules that do not favour setting a target (or for that matter, chasing a target), will be the catalyst that revives the contest between bat and ball. The basis of this contest is taking wickets. Under such rules, de Villiers may not produce the outrageous numbers he has under the 2012 rules. But perhaps 70 runs from him will go a long way, much further than they did under the 2012 rules.
Kartikeya Date writes at A Cricketing View and tweets here