A surfeit of draws
India start the series as overwhelming favourites, but New Zealand should be encouraged by the number of draws they've managed in India
S Rajesh
22-Aug-2012
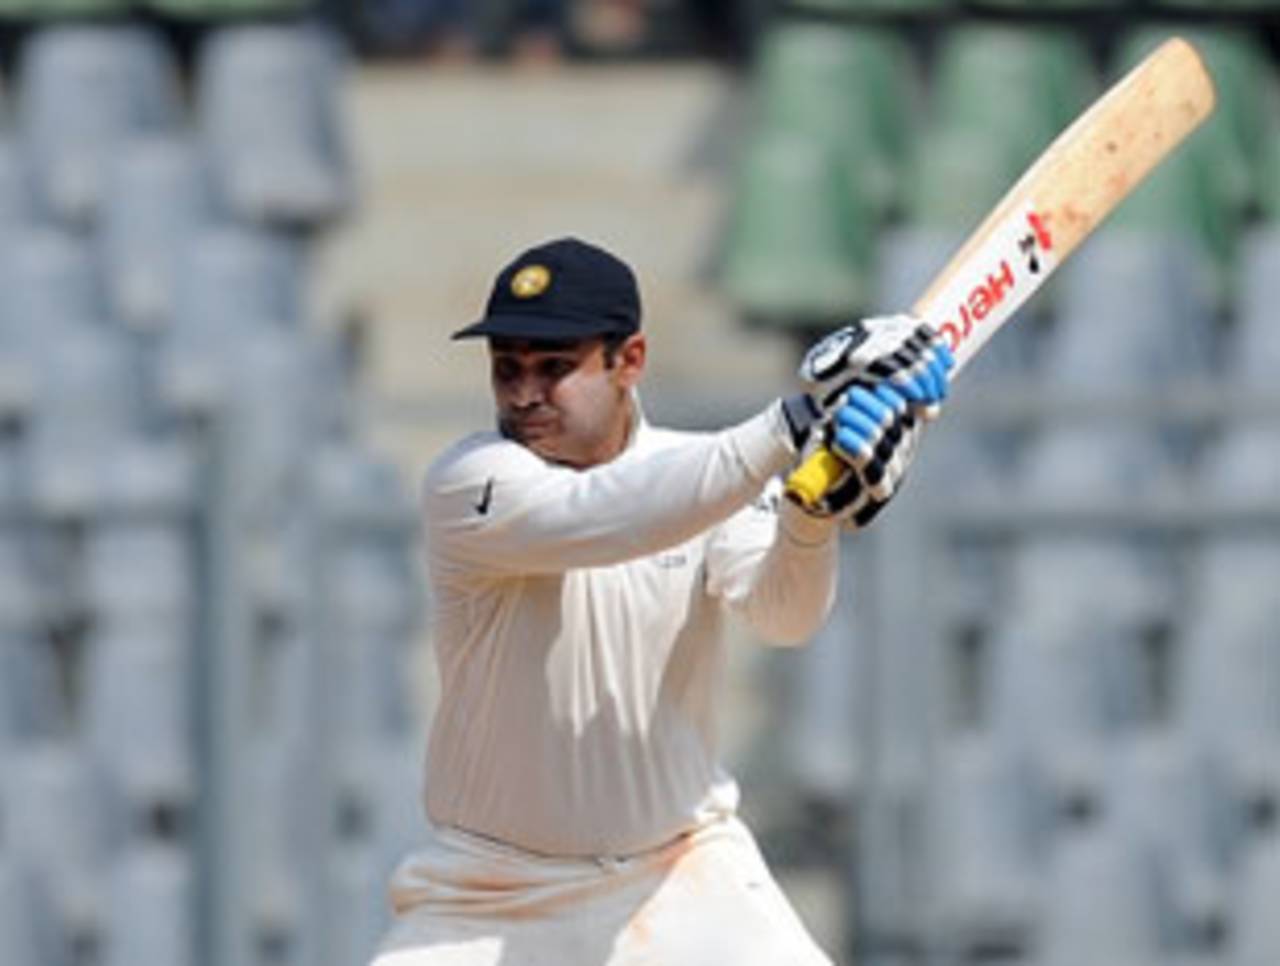
Virender Sehwag averages almost 72 in five home Tests against New Zealand • AFP
India haven't lost a home Test series since November 2004, winning nine out of 13; New Zealand haven't won an away series against a team other than Bangladesh and Zimbabwe since 2002: in 12 series since then they've lost nine and drawn three. It's pretty obvious that, given these stats, India will go into the two-Test series as overwhelming favourites, even without the services of Rahul Dravid and VVS Laxman.
India's home record in these last eight years is daunting: 18 wins and four defeats in 36 Tests. Among teams that have played more than 15 home Tests, only Australia have a better win-loss ratio. During this period, they've won two series each against Sri Lanka and Australia, and one against South Africa, Pakistan, England, New Zealand and West Indies.
In the face of such staggeringly one-sided stats, New Zealand's only hope seems to be the high number of draws that are played out in India and in the matches between these two teams. The draw percentage in India since November 2004 is 38%, only marginally lower than West Indies' 40% - these are the two countries with the highest draw percentage during this period. Also, the draw percentage in India-New Zealand Tests is 50% (25 draws in 50 Tests), which is second only to the number of stalemates in India-Pakistan Tests. In 11 Tests between India and New Zealand in India since 1990, eight have been drawn.
| Tests | Ind won | NZ won | Draw | |
| Overall | 50 | 16 | 9 | 25 |
| In India | 29 | 11 | 2 | 16 |
| In India since 1990 | 11 | 3 | 0 | 8 |
| Teams | Tests | Wins (T1/ T2) | Draws | Draw % |
| India v Pakistan | 59 | 9/ 12 | 38 | 64.41 |
| India v New Zealand | 50 | 16/ 9 | 25 | 50.00 |
| India v West Indies | 88 | 14/ 30 | 44 | 50.00 |
| England v Pakistan | 74 | 22/ 16 | 36 | 48.65 |
| New Zealand v West Indies | 39 | 9/ 12 | 18 | 46.15 |
New Zealand's lack of bowling firepower has been a serious problem for them on their tours to India. In their last three series in India, they've averaged 46.81, 50.76 and 48.92 runs per wicket, and about 12 wickets per Test, which aren't the kind of numbers that win matches.
Both pace and spin have been pretty ineffective for them in India. Fast bowlers have averaged 48.44, and spinners 51.28 runs per wicket. Chris Martin has done reasonably well, taking nine wickets at 34.11, but for most of the others it has been a struggle. Daniel Vettori is missing this time, but he hasn't had too much success either in India: though he has 31 wickets in eight Tests, they've come at an average of 44.77.
| Bowling type | Wickets | Average | Strike rate | 5WI/ 10WM |
| Pace | 50 | 48.44 | 98.6 | 2/ 0 |
| Spin | 45 | 51.28 | 103.8 | 2/ 0 |
With such a weak opposition bowling attack, the Indian batsmen have obviously made merry. Both Dravid and Laxman scored plenty of runs against New Zealand, but even in their absence, the Indian batting line-up should have enough firepower, especially in home conditions, to handle Martin and Co. Virender Sehwag has especially enjoyed facing the New Zealand bowlers in India: he averages 71.87 in five Tests, with two hundreds and three fifties (though in New Zealand he averages only 20 in five Tests, with a highest of 48). Gautam Gambhir, on the other hand, has a much better average in New Zealand (89 in three Tests) than in India (41.75 in three). For Sachin Tendulkar, though, the numbers are very even: he averages 49.28 in 11 Tests in India, and 49.52 in as many Tests in New Zealand. The series could also be an opportunity for Suresh Raina to make amends for his poor display against New Zealand in 2010, when he scored 26 in four innings.
New Zealand, meanwhile, will also be glad they won't have to contend with Harbhajan Singh the batsman in the Tests - in 2010, Harbhajan scored hundreds in successive Tests, and averages 81 with the bat against New Zealand in India.
| Batsman | Overall-Tests | Average | 100s/ 50s | In India-Tests | Average | 100s/ 50s |
| Sachin Tendulkar | 22 | 49.41 | 4/ 8 | 11 | 49.28 | 2/ 3 |
| Virender Sehwag | 10 | 44.41 | 2/ 3 | 5 | 71.87 | 2/ 3 |
| Gautam Gambhir | 6 | 68.00 | 2/ 3 | 3 | 41.75 | 0/ 2 |
| MS Dhoni | 5 | 49.83 | 0/ 3 | 3 | 36.00 | 0/ 1 |
| Suresh Raina | 3 | 6.50 | 0/ 0 | 3 | 6.50 | 0/ 0 |
Among the Indian bowlers in the current squad, Zaheer Khan, Pragyan Ojha and Ishant Sharma have played home Tests against New Zealand. Zaheer has a good record against New Zealand, having taken 35 wickets in nine Tests, but only 11 of those have come in four Tests in India. Zaheer might have to work slightly harder for his wickets this time, given that Tim McIntosh won't be a part of New Zealand's top order: in five Tests, Zaheer has dismissed him six times, inclusive of three ducks.
Ojha has taken 12 wickets in three home Tests against New Zealand at 37.41, while Ishant Sharma, whose selection has created a fair amount of debate, had a superb Test against New Zealand in Nagpur in 2010, finishing with a match haul of 7 for 58, the second-best haul in his Test career.
Over the last year, though, Ishant has struggled for wickets, taking 21 in 11 Tests at 68. With Anil Kumble not around either, New Zealand's batsmen must believe they can bat long enough against this India attack to ensure competitive Tests. Brendon McCullum has a second-innings double-century here - becoming only the second overseas batsman to achieve this feat in India - while Kane Williamson scored a century on debut in Ahmedabad. However, they'll want more from Ross Taylor and Martin Guptill, both of whom averaged less than 30 on their previous tour to India.
| Batsman | Overall-Tests | Average | 100s/ 50s | In India-Tests | Average | 100s/ 50s |
| Brendon McCullum | 6 | 60.20 | 2/ 2 | 3 | 74.00 | 1/ 1 |
| Ross Taylor | 6 | 45.80 | 2/ 1 | 3 | 27.20 | 0/ 1 |
| Martin Guptill | 5 | 27.22 | 0/ 1 | 2 | 27.25 | 0/ 1 |
| Kane Williamson | 3 | 42.40 | 1/ 1 | 3 | 42.40 | 1/ 1 |
S Rajesh is stats editor of ESPNcricinfo. Follow him on Twitter