The Confectionery Stall Top Four Stats of 2015
Or: Four Stats I Have Dug Up and Polished Before Deciding it Was Bedtime and They Would Have to Do For the Stats of the Year
Andy Zaltzman
19-Dec-2015
Out, vile stick: wicketkeepers were severely stumping-happy in 2015 • Getty Images
Stats correct up to the start of the Hamilton Test
STAT 1. In their recent tweak-aggravated demolition by India, South Africa were bowled out in less than 50 overs on three occasions - as many less-than-50-over skittlings as they had suffered away from home in the previous 83 years, in a total of 152 Tests.
After being demolished at the MCG in February 1932 - bowled out for 36 and 45 in a total of 54.5 overs - the South Africans had been bowled out in fewer than 300 balls only at Lord's and Nottingham in 1960, and in Ahmedabad in November 1996. Then they went to India. And India saw them coming. In the space of five weeks of remorseless slow-bowling cross-examination on pitches that must have made Hedley Verity and Clarrie Grimmett contemplate comebacks from their long-occupied graves, the Proteas added Mohali, Nagpur and Delhi to that list. They lasted a comparatively heroically long-winded 59 overs in their one innings in Bangalore before the merciful rains denied them the opportunity to subside again.
After being demolished at the MCG in February 1932 - bowled out for 36 and 45 in a total of 54.5 overs - the South Africans had been bowled out in fewer than 300 balls only at Lord's and Nottingham in 1960, and in Ahmedabad in November 1996. Then they went to India. And India saw them coming. In the space of five weeks of remorseless slow-bowling cross-examination on pitches that must have made Hedley Verity and Clarrie Grimmett contemplate comebacks from their long-occupied graves, the Proteas added Mohali, Nagpur and Delhi to that list. They lasted a comparatively heroically long-winded 59 overs in their one innings in Bangalore before the merciful rains denied them the opportunity to subside again.
Furthermore, South Africa had not posted a sub-150 score in 33 Tests over four years, since November 2011. They failed to reach the 150 mark in four innings in the four Tests in India. Away from home, they had been bowled out for under 150 only once in 57 Tests since August 2003.
Overall it has been a good year for collapse fans. In the 40 Tests played this year, teams have been bowled out for under 150 on 15 occasions, ranging in length from Australia's 111-ball, Ashes-surrendering, Broad-immortalising 60 all out at Trent Bridge, to South Africa's epically ineffective, Boycott-shaming 143.1-over 143 all out in Delhi.
Seventeen times in 40 Tests has a team been dismissed in under 50 overs, the most in a year since 2005, and a rate of 2.35 Tests per sub-50-over blast-out. From 2000 to 2014, teams had been bowled out in under 300 balls once every 3.56 Tests. In all Tests played from 1920 to 1999, the rate was once every 7.05 Tests.
Stat conclusions:
a) Modern batsmen possess many skills that previous generations did not have. Disappearing down a collective plughole in an array of technically questionable shots is one of the less useful of those skills.
a) Modern batsmen possess many skills that previous generations did not have. Disappearing down a collective plughole in an array of technically questionable shots is one of the less useful of those skills.
b) There have been some silly pitches this year, and even sillier batting, and not just in the recent Indian triumph.
c) Bring back Kallis. And Gary Kirsten. And Jackie McGlew. And Bruce Mitchell. Will there ever be a true South African grinder again?
STAT 2. West Indies have completed a 21st consecutive year in which they have failed to win more Tests than they have lost.
The last time West Indies had a "winning year" was 1994, with four wins and two losses. They had the same number of wins and losses in both 1995 and 1996, then 15 consecutive losing years from 1997 to 2011. Wins over Bangladesh helped them achieve results parity in 2012 and 2014, either side of a dismal 2013, when they were thoroughly clouted in India and New Zealand.
The last time West Indies had a "winning year" was 1994, with four wins and two losses. They had the same number of wins and losses in both 1995 and 1996, then 15 consecutive losing years from 1997 to 2011. Wins over Bangladesh helped them achieve results parity in 2012 and 2014, either side of a dismal 2013, when they were thoroughly clouted in India and New Zealand.
In 21 consecutive years from 1976 to 1996, West Indies never lost more Tests than they won, and posted 17 winning years out of 19, up to and including 1994. Watching their "display" in Hobart, it was possible to conclude that some of the current side would have struggled to get in as spectators in the 1980s, let alone as players.
A loss in the Boxing Day Test at the MCG would be West Indies' eighth Test defeat in 2015, equalling their record number of defeats in a year, set in 2004 and 2005.
It would also make them only the second team in Test history to play 10 or more Tests in a year and lose at least 80% of them, after England in 1993 (played 10, lost eight).
Stat conclusions:
a) I really don't want to think about it.
a) I really don't want to think about it.
b) Cricket doesn't really want to think about it.
c) Someone should really think about it.
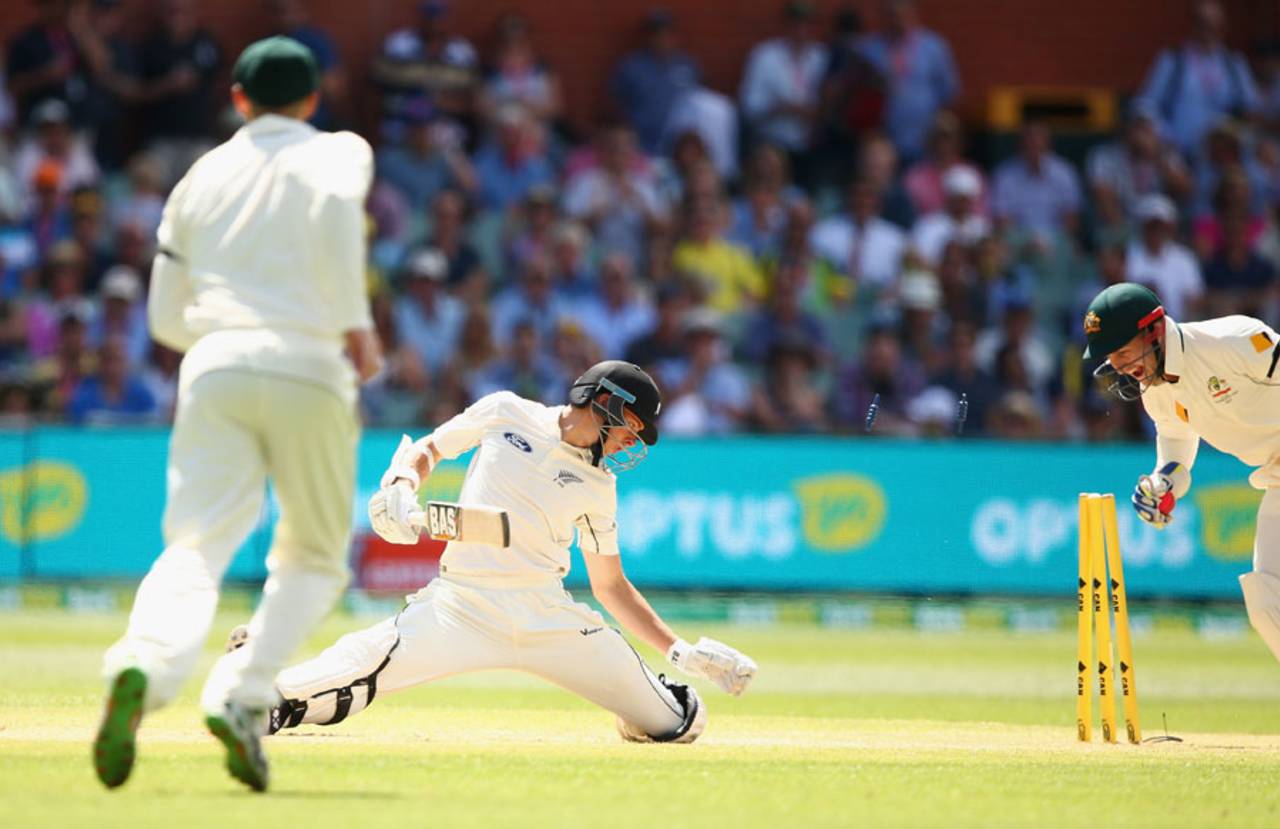
STAT 3: Test stumpings have occurred at their highest rate since 1956.
If you like seeing bails whipped off by grinning wicketkeepers, this has been a fun year for you. There were 37 stumpings in the first 40 Tests of the year this year. With three Tests remaining (including the Hamilton Test now underway), that is already the second most stumpings in a year, behind the 41 sets of bails whipped off by glovemen in 2004 (in 51 Tests).
If you like seeing bails whipped off by grinning wicketkeepers, this has been a fun year for you. There were 37 stumpings in the first 40 Tests of the year this year. With three Tests remaining (including the Hamilton Test now underway), that is already the second most stumpings in a year, behind the 41 sets of bails whipped off by glovemen in 2004 (in 51 Tests).
Even if there are no more Test stumpings, and the current figure of 0.92 stumpings per Test drops to 0.86, it will remain the highest rate since 1956, when 16 batsmen were caught out of their ground in 15 Tests (although only two of Jim Laker's 46 Ashes wickets was a stumping).
Before Hamilton, there had been one stumping every 338 overs of Test cricket this year, again the highest rate since 1956 regardless of whether or not there are any more such dismissals before the end of December.
This decade as a whole has seen the highest rate of Test stumpings since the 1950s. Up to the end of the 1950s, 3.46% of all Test dismissals were stumpings. Since then, that figure has fallen to 1.61%, suggesting that as the world became more sexually liberated in the Swinging Sixties, batting became considerably more prim and less willing to be caught with its metaphorical trousers down.
The least stumpedous decade was the 1980s, when there was on average only one stumping every two and a half Tests, or one every 808 overs, making stumping less than half as frequent as in the 1950s.
Of the years in which more than five Tests have been played, the stumpiest was 1921 - 20 stumpings in 11 Tests, one every 178 overs, suggesting that, having survived the world's most devastating conflict, batsmen were not too fussed at the prospect of being stranded a yard or two down the wicket having a swing at a cricket ball. Perspective is a wonderful thing.
Stat conclusions:
a) Perhaps, T20 has made batsmen more willing to come down the pitch, but not necessarily better at it.
a) Perhaps, T20 has made batsmen more willing to come down the pitch, but not necessarily better at it.
b) There have been some silly pitches this year, and even sillier batting, and not just in the recent Indian triumph.
c) I love stumpings.
STAT 4: 2015 was, comfortably, the best year for ODI batsmen, with record scoring rates (5.51 per over), the highest collective batting average (31.40) (excluding 1974, when only six ODIs were played), the highest strike rate (87.1), and the most centuries (106, smashing the previous bests of 77 in 2013 and 79 in 2014).
The 2013-2015 ODI fielding regulations unsurprisingly resulted in a deluge of run-scoring, such that even England, who began their ODI year apparently trying to bat their way back to the 1980s, found themselves scoring 400 without being unduly surprised or even slightly disappointed. There were six 400-plus scores in total this year; there had been only one between March 2010 and October 2014, and 11 in all ODIs played up to the end of last year. There have been a year-record ten individual scores of 150 or more.
The 2013-2015 ODI fielding regulations unsurprisingly resulted in a deluge of run-scoring, such that even England, who began their ODI year apparently trying to bat their way back to the 1980s, found themselves scoring 400 without being unduly surprised or even slightly disappointed. There were six 400-plus scores in total this year; there had been only one between March 2010 and October 2014, and 11 in all ODIs played up to the end of last year. There have been a year-record ten individual scores of 150 or more.
Those 106 centuries have been scored at a rate of one every 1.33 ODIs, comfortably a record, and down from 1.55 in 2014 and 1.77 in 2013. From 2000 to 2012, ODI hundreds were scored at one every 2.42 matches; up to 1999, it was one hundred per 3.24 games. Furthermore, in 2015 the conversion rate of ODI fifties into hundreds hit a record high of 24.8%. It was 21.5% in 2013 and 2014 combined; in the 2000-2012 period, it was 16.2%, and in the 20th century, it was 13.5%.
Stat conclusions:
a) It is easier to score hundreds when there aren't so many fielders on the boundary. And when the ball never gets more than 25 overs old.
a) It is easier to score hundreds when there aren't so many fielders on the boundary. And when the ball never gets more than 25 overs old.
b) Modern batsmen possess many skills that previous generations did not have.
c) If things keep progressing at this rate, by the year 2143, every single ODI innings will be a triple-century.
Andy Zaltzman is a stand-up comedian, a regular on BBC Radio 4, and a writer