Pace domination, and Kettleborough's 100% success rate
South Africa outdid Australia in the fast bowling department, the lower middle-order contributions and the number of centuries scored
S Rajesh
28-Nov-2016
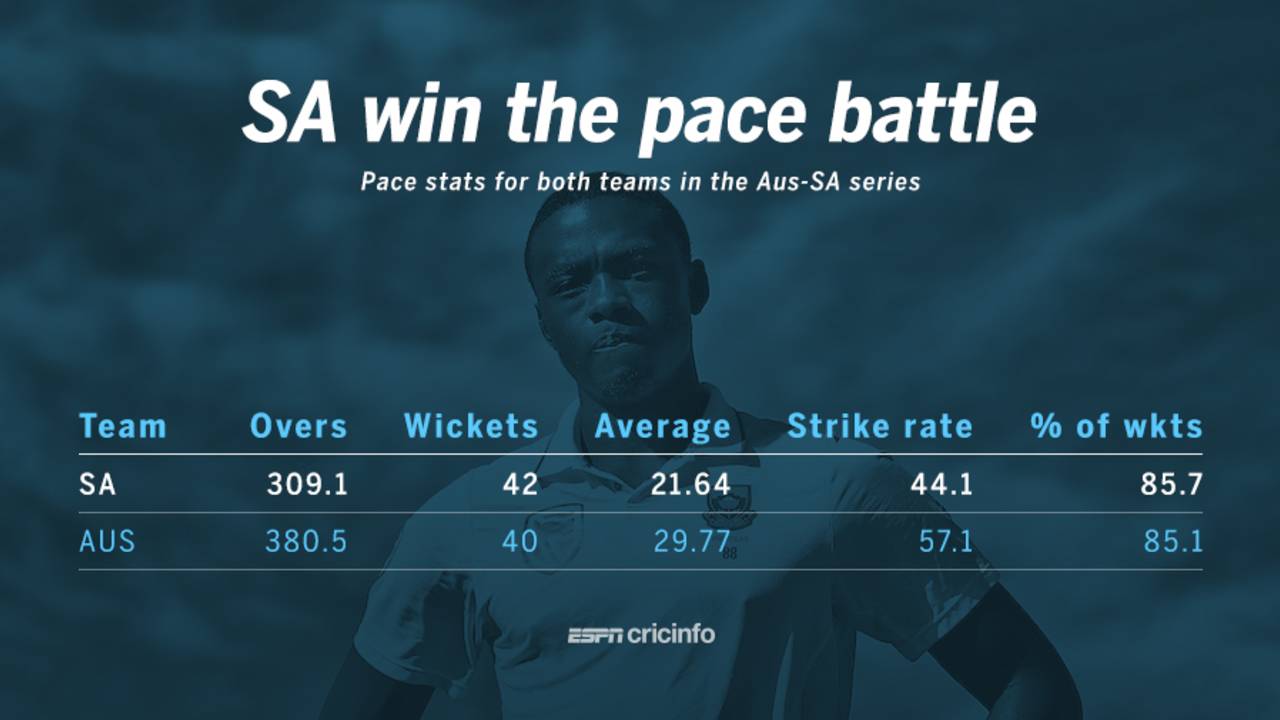
South Africa's trio of fast bowlers won the pace battle against Australia • ESPNcricinfo Ltd
21.64 The bowling average for South Africa's fast bowlers in the series, compared to 29.77 for Australia's pace attack. Kagiso Rabada, Kyle Abbott and Vernon Philander accounted for 40 of those 42 wickets, at 20.30. Australia's pace attack had a combined average of 29.77. Mitchell Starc and Josh Hazlewood, Australia's leading fast bowlers, had a combined tally of 31 wickets at 25.71. Each team's spinners took seven wickets collectively, at 50-plus averages (52.42 for Australia, and 58.14 for South Africa). Fast bowlers accounted for more than 85% of the total wickets for each team.
82 Total wickets taken by the fast bowlers in the series. There have been only three three-Test series in Australia in which fast bowlers have taken more wickets, and all of them were between 1979 and 1982; two of those featured West Indies.
| Series | Wickets | Average | Strike rate | 5WI |
| WI in Aus, 1979-80 | 89 | 27.41 | 56.2 | 2 |
| Eng in Aus, 1979-80 | 88 | 22.25 | 58.4 | 5 |
| WI in Aus, 1981-82 | 85 | 27.12 | 60.8 | 6 |
| SA in Aus, 2016-17 | 82 | 25.60 | 50.4 | 4 |
| NZ in Aus, 1980-81 | 80 | 21.61 | 53.1 | 5 |
| SA in Aus, 2008-09 | 80 | 35.55 | 68.8 | 4 |
5 Hundreds for South Africa, out of the six in the series. Australia's only centurion was Usman Khawaja, while five batsmen got hundreds for South Africa - Dean Elgar, JP Duminy, Quinton de Kock, Faf du Plessis and Stephen Cook. (Click here for South Africa's batting and bowling stats, and here for Australia's.)
| Team | Runs scored | Bat ave | Run rate | 100s |
| South Africa | 1617 | 34.40 | 3.32 | 5 |
| Australia | 1361 | 25.67 | 3.06 | 1 |
41.25 The average partnership for South Africa's fifth to eighth wickets; for Australia, the average for those wickets was only 17.15. In 20 partnerships for these wickets, South Africa's batsmen scored 825 runs, with de Kock being the key contributor: he scored 281 from five innings, and received fine support from Temba Bavuma and Philander in these middle and lower-order partnerships. In contrast, Australia managed only 343 runs in 20 such partnerships. The difference in these partnership numbers was a key reason for South Africa's series triumph; for the first four wickets Australia had a marginally higher average - 37.82, to South Africa's 34.05.
| South Africa | Australia | |||||
| Wicket | Runs | Average | 100/50 stands | Runs | Average | 100/50 stands |
| 1st | 91 | 18.20 | 0/ 0 | 295 | 49.16 | 1/ 2 |
| 2nd | 121 | 24.20 | 0/ 1 | 106 | 17.66 | 0/ 1 |
| 3rd | 324 | 64.80 | 1/ 0 | 347 | 57.83 | 1/ 3 |
| 4th | 145 | 29.00 | 0/ 1 | 122 | 24.40 | 0/ 1 |
| 5th | 185 | 37.00 | 0/ 1 | 68 | 13.60 | 0/ 1 |
| 6th | 257 | 51.40 | 1/ 1 | 101 | 20.20 | 0/ 1 |
| 7th | 174 | 34.80 | 1/ 0 | 89 | 17.80 | 0/ 0 |
| 8th | 209 | 41.80 | 0/ 2 | 85 | 17.00 | 0/ 0 |
| 9th | 28 | 7.00 | 0/ 0 | 99 | 19.80 | 0/ 1 |
| 10th | 83 | 27.66 | 0/ 0 | 49 | 9.80 | 0/ 0 |
100% Success rate for Richard Kettleborough with DRS appeals made against his decisions in Hobart and Adelaide, the two Tests in which he was the on-field umpire in the series. In all, 11 of his decisions were challenged, but none of his calls were overturned. In contrast, the success rate was only 50% for Aleem Dar (six out of 12), and 68.75% for Nigel Llong (11 out of 16).
5 Number of times Hazlewood dismissed Hashim Amla in this series, the most times a bowler got a batsman out. The next highest was Starc's four dismissals of Cook, conceding only 43 from 134 balls. Elgar struggled against Starc as well. There were five instances of a bowler dismissing a batsman three or more times in the series, and they were all by Starc or Hazlewood.
97 Runs scored by de Kock against Nathan Lyon, the most by any batsman against a bowler in the series. Lyon didn't dismiss de Kock even once, though he had him in some trouble in Adelaide. There were only two other instances of a batsman scoring 50-plus runs against a bowler without being dismissed - Warner against Rabada, and Bavuma against Starc.
| Batsman | Bowler | Runs | Balls | Dismissals | Average |
| Hashim Amla | Josh Hazlewood | 29 | 52 | 5 | 5.80 |
| Stephen Cook | Mitchell Starc | 43 | 134 | 4 | 10.75 |
| Dean Elgar | Mitchell Starc | 38 | 97 | 3 | 12.66 |
| Quinton de Kock | Josh Hazlewood | 60 | 99 | 3 | 20.00 |
| Faf du Plessis | Mitchell Starc | 87 | 106 | 3 | 29.00 |
| JP Duminy | Josh Hazlewood | 61 | 105 | 1 | 61.00 |
| JP Duminy | Mitchell Starc | 52 | 67 | 1 | 52.00 |
| Usman Khawaja | Kyle Abbott | 48 | 116 | 1 | 48.00 |
| Usman Khawaja | Kagiso Rabada | 57 | 126 | 1 | 57.00 |
| Steven Smith | Kyle Abbott | 55 | 77 | 1 | 55.00 |
| David Warner | Vernon Philander | 63 | 105 | 1 | 63.00 |
| Temba Bavuma | Mitchell Starc | 63 | 106 | 0 | - |
| Quinton de Kock | Nathan Lyon | 97 | 115 | 0 | - |
| Quinton de Kock | Mitchell Starc | 40 | 72 | 0 | - |
| David Warner | Kagiso Rabada | 67 | 60 | 0 | - |
S Rajesh is stats editor of ESPNcricinfo. @rajeshstats