Australia's near-total dominance
Australia, who have dominated Sri Lanka completely both home and away in the last decade, start clear favourites in the Test series beginning in Hobart
Madhusudhan Ramakrishnan
13-Dec-2012
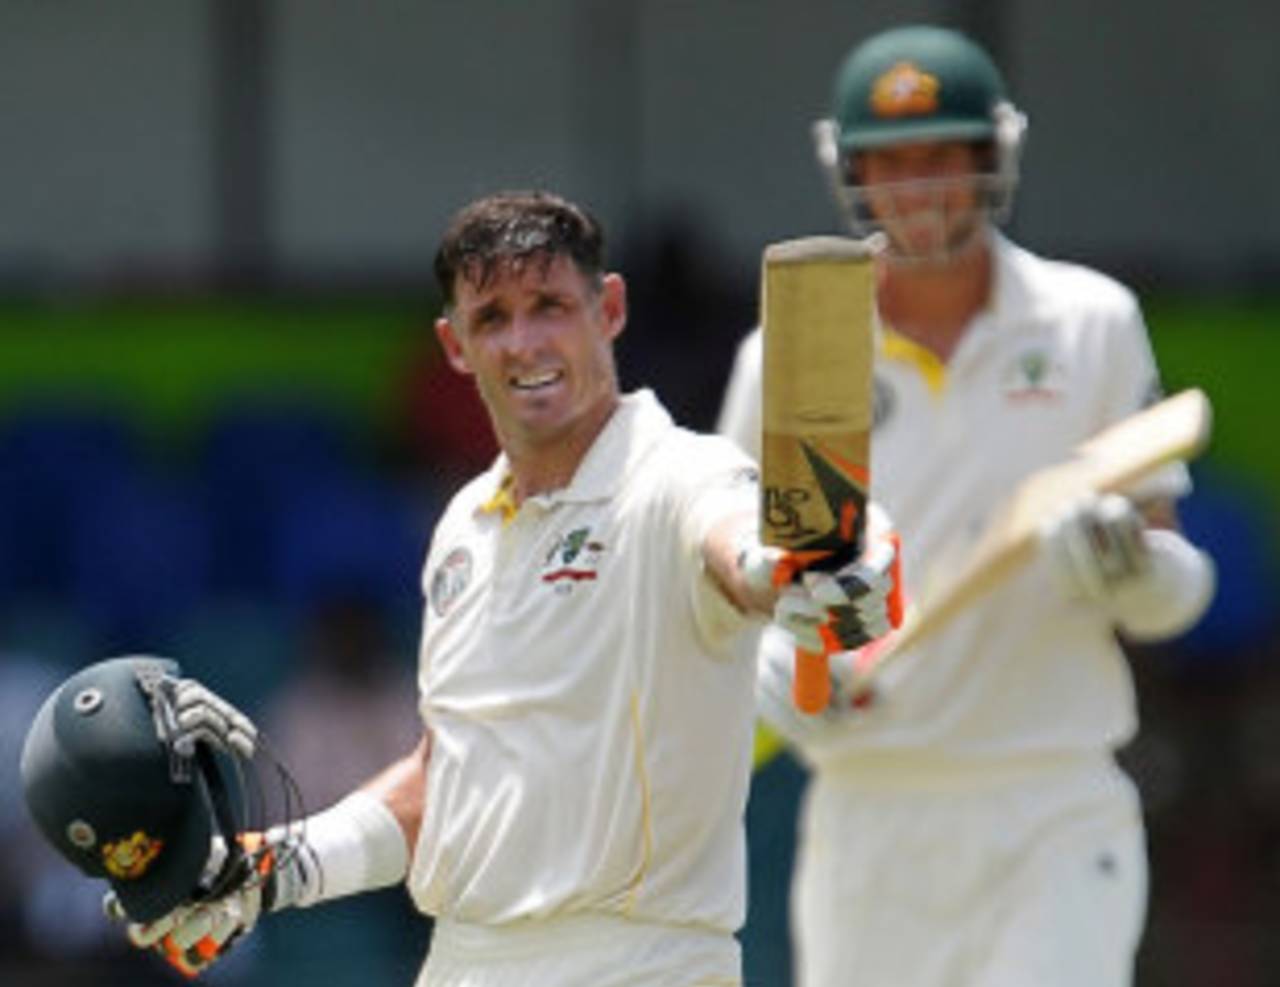
Michael Hussey was the top run-scorer in the three-Test series in Sri Lanka last year • AFP
Such has been Australia's record in head-to-head contests that it is virtually impossible to expect Sri Lanka to pose a serious challenge in the three-Test series beginning in Hobart. Although Sri Lanka lost both Tests on their last tour of Australia in 2007-08, they put up a serious fight in the second Test before going down by 96 runs. Australia have been the only team to regularly win in Sri Lanka too - in their last two series in Sri Lanka, Australia won 3-0 and 1-0. Following the retirement of top players, Australia have had to work much harder for their success but are still a force to reckon with at home, Since 2007, they have lost three home series (twice to South Africa and once against England) but have a 11-1 record at home against major subcontinent teams (excludes Bangladesh).
Sri Lanka have struggled both home and away in the last two years following Muttiah Muralitharan's exit. Since 2010, Sri Lanka have lost one and drawn four home series with their only triumph coming against Pakistan earlier this year. Sri Lanka, who are yet to win a single Test in two countries (Australia and India), will draw confidence from their performance in last year's Boxing Day Test in Durban when they went on to register their first win-loss ratio of 11.00 (Tests since 1990) against Sri Lanka is the best among all head-to-head contests (excluding Bangladesh games).
| Played | Wins | Losses | Draws | W/L ratio | |
| In Australia | 7 | 0 | 6 | 1 | 0.00 |
| In Sri Lanka | 12 | 1 | 5 | 6 | 0.20 |
| Since 2000 (in Sri Lanka) | 6 | 0 | 4 | 2 | 0.00 |
| Since 2000 (in Australia) | 4 | 0 | 3 | 1 | 0.00 |
| Overall (since 1990) | 19 | 1 | 11 | 7 | 0.09 |
In the 2004 series, which was dominated by Shane Warne's successful return to cricket following his ban, Australia conceded leads of 161 and 91 runs in the first two Tests in Galle and Kandy but managed to turn the matches around with impressive batting displays in the second innings. Sri Lanka, who lost the series 3-0, averaged 28.75 while the visitors averaged 35.68. The average difference (difference between batting averages of Australia and Sri Lanka) was higher in the subsequent series in Australia. In the 2004 series in Australia, the hosts dominated the contests and scored four more centuries than Sri Lanka. However, the average difference (89.28) was the highest by far in the 2007 series in Australia which the hosts won 2-0. Apart from Kumar Sangakkara, who played an outstanding innings of 192 in Hobart, no other Sri Lankan batsman looked comfortable in the conditions in Australia. The 2011 series in Sri Lanka was also dominated by Australia, who won 1-0. The visitors won a low-scoring first Test in Galle by 125 runs and dominated the drawn second Test in Pallekele where Michael Hussey and Shaun Marsh scored centuries. Not only did Australia score more centuries in the 2011 series, they also ended with a much higher batting average than the hosts (average difference 7.23).
| Series | Result | Australia (bat avg) | Sri Lanka (bat avg) | Avg diff | Aus (100/50) | Sri Lanka (100/50) |
| 2004 (in Sri Lanka) | 3-0 (Australia) | 35.68 | 28.75 | 6.93 | 3/6 | 1/3 |
| 2004 (in Australia) | 1-0 (Australia) | 31.20 | 23.60 | 7.60 | 7/4 | 3/6 |
| 2007 (in Australia) | 2-0 (Australia) | 118.45 | 29.17 | 89.28 | 5/7 | 2/4 |
| 2011 (in Sri Lanka) | 1-0 (Australia) | 36.12 | 28.89 | 7.23 | 5/4 | 2/8 |
Hussey was outstanding in the last series played between the two teams in 2011 scoring 95 in the first Test and centuries in the second and third Tests. He has been virtually untroubled by both Sri Lankan pace bowlers and spinners averaging 121 and 99.75 against them respectively while scoring at a fair clip. Michael Clarke, who became the first player to score four double-centuries in a calendar year, averages 62.33 and 81 against the fast bowlers and spinners. Phillip Hughes, who is likely to play at No.3 following Ricky Ponting's retirement, has been comfortable against pace (average 57.00) but has struggled against spinners (average 29.33 with three dismissals).
Sangakkara, the top run-getter in Sri Lanka's previous series in Australia, has an average of 45 against both fast bowlers and spinners. However, he has managed a much higher scoring rate (3.89) against the slower bowlers and has been dismissed four fewer times. Mahela Jayawardene, Sri Lanka's captain, has found the going tough against Australian pace bowlers falling 14 times (average 24.71). In contrast, he has looked very comfortable against spinners averaging 102 (three dismissals). Tillakaratne Dilshan, who averages just 29.28 in eight Tests against Australia, has fallen nine times to fast bowlers (average 26.44) and five times to spinners (31.00).
| Batsman | Pace (Average/ dismissals) | Pace (scoring rate/balls per dismissal) | Pace (Average/dismissals) | Spin (scoring rate/balls per dismissal) |
| Michael Hussey | 121.00/3 | 3.95/183.6 | 99.75/4 | 3.23/185.0 |
| Michael Clarke | 62.33/3 | 3.22/116.0 | 81.00/3 | 3.92/123.6 |
| Phillip Hughes | 57.00/2 | 3.45/99.0 | 29.33/3 | 2.37/74.0 |
| Kumar Sangakkara | 45.00/10 | 2.69/100.2 | 45.00/6 | 3.89/69.3 |
| Mahela Jayawardene | 24.71/14 | 2.19/67.5 | 102.00/3 | 3.03/201.3 |
| Tillakaratne Dilshan | 26.44/9 | 3.05/51.8 | 31.00/5 | 4.02/46.2 |
Australia shockingly lost the Hobart Test against New Zealand on a surface designed to suit the pace bowlers. The batting average in Hobart is highest in the first innings(41.21) but falls to 27.22 in the second innings. The corresponding numbers in the third and fourth innings are 36.62 and 29.90. In Melbourne, the averages in each of the four innings are below 35 with the lowest coming in the fourth innings (23.75). Sydney, the venue for the third Test, has been an excellent batting wicket in the second innings (average 48.25). However, the average falls to 33.57 and 26.88 in the third and fourth innings. Spinners have been quite effective in Hobart picking up 34 wickets (average 36.26) while pace bowlers have picked up 90 wickets at 33.00. While fast bowlers have completely dominated the stats at the MCG picking up 177 wickets at 27.74, spinners have managed just 50 wickets at 41.44. Spinners have picked up a significant percentage of the wickets in Sydney but have a higher average (39.12) as compared to the pace bowlers (34.77).
| Venue | 1st inns/2nd inns | 3rd inns/4th inns | Pace (wkts, avg) | Spin (wkts, avg) |
| Hobart | 41.21/27.22 | 36.62/29.90 | 90, 33.00 | 34, 36.26 |
| Melbourne | 32.86/34.75 | 29.55/23.04 | 177, 27.74 | 50, 41.44 |
| Sydney | 32.55/48.25 | 33.57/26.88 | 187, 34.77 | 93, 39.12 |
Madhusudhan Ramakrishnan is a sub-editor (stats) at ESPNcricinfo