Sri Lanka bank on batting consistency
Sri Lanka don't have a great record in tri-series finals in Australia, but the form of their top order could make a vital difference this time
S Rajesh
03-Mar-2012
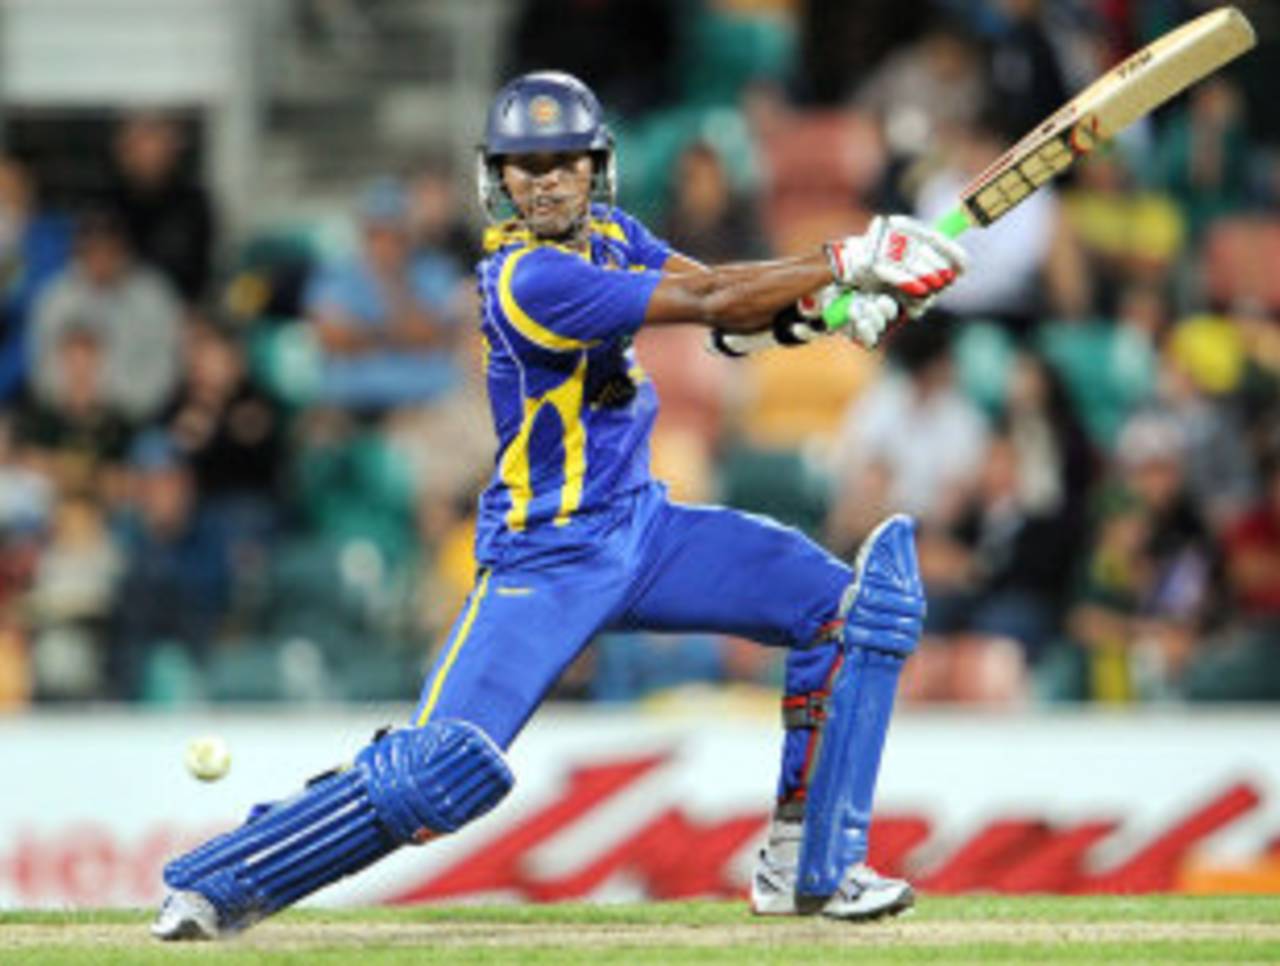
Dinesh Chandimal has been the batting star of the tournament so far • AFP
In the end, the two teams that deserved to the most made it to the CB Series finals. For a long time during the last league match between Australia and Sri Lanka, India would have harboured chances of sneaking through, but it would have been just that - sneaking through, at the expense of a team that had been more consistent through the tournament.
In the first half of the competition, Sri Lanka lost tight matches to Australia and India, and tied one against India, but in the second half they turned it around with convincing victories against both teams. The shock defeat against India in Hobart was a bolt from the blue, but they were good enough to bounce back from that result despite being a couple of bowlers short against Australia at the MCG.
The overall stats for the three teams indicate how the tournament has gone for them. Sri Lanka have easily been the best batting side, thanks to the consistency of their top order. Dinesh Chandimal has been a revelation, slotting in at second* on the tournment's run charts after the league stage with 383 runs at an average of almost 64, while Tillakaratne Dilshan, Mahela Jayawardene, Kumar Sangakkara and Angelo Mathews have all played their part. Overall, their top five have a combined average of 42.25 in the CB Series so far, which is their third-highest ever in a series of five or more matches outside Asia. The corresponding averages for the top five are 30.26 for India and 29.27 for Australia.
Overall, Sri Lanka have five batsmen averaging more than 35 in the tournament, compared to three each for Australia and India. For a team that has generally relied on Sangakkara and Jayawardene for most of their runs, this is a huge plus. In fact, India's numbers went up significantly because of that stunning chase in their last match of the tournament in Hobart. Exclude that, and India's runs per wicket falls to 24.13, at a run rate of 4.83 per over.
As a bowling unit, Australia were the best, while India were the poorest in that aspect as well. The Australians took 65 wickets at 25.58 each, and they were also the only side to concede less than five runs per over. Sri Lanka took 64 wickets, but their average touched 30. Both teams have bowlers who have taken more than ten wickets - Lasith Malinga leads the tally with 14, while Daniel Christian has 13 and Clint McKay 10. For India, though, the highest wicket-taker was Vinay Kumar with nine; in all the Indians took only 54 wickets in their eight games, at an average touching 39 and a run rate of 5.50.
| Team | W/L/T | Bat ave | Run rate | Bowl ave | Econ rate |
| Sri Lanka | 4/3/1 | 35.30 | 5.29 | 30.10 | 5.24 |
| Australia | 4/4/0 | 30.52 | 5.18 | 25.58 | 4.95 |
| India | 3/4/1 | 28.01 | 5.26 | 38.94 | 5.50 |
India had a better start to the tournament compared to Sri Lanka, but as the competition progressed Sri Lanka upped their game and were the more consistent side. The records of these two sides against Australia indicate how much better Sri Lanka played against the hosts. They won three of four matches against Australia, who averaged less than 25 runs per wicket against Sri Lanka with the bat, and conceded 31 per wicket with the ball. Australia also managed to score at just 4.74 runs per over, and conceded almost 5.20.
Against India, Australia were dominant. They scored almost 38 runs per wicket at 5.63 runs per over, and allowed the hapless Indian batsmen only 21 runs per wicket. Given a choice, it's clear whom the Australians would have preferred to face in the finals.
| Versus | W/L | Bat ave | Run rate | Bowl ave | Econ rate |
| India | 3/ 1 | 37.96 | 5.63 | 21.22 | 4.70 |
| Sri Lanka | 1/ 3 | 24.94 | 4.74 | 31.00 | 5.18 |
Now that they are in the finals, Sri Lanka will have to banish memories from the two previous seasons when they reached this stage of the tri-series in Australia. The most recent instance was in 2005-06, when South Africa were the third side. Sri Lanka won the first of three finals that time, beating Australia by 22 runs in Adelaide. In the second final in Sydney, they had Australia reeling at 10 for 3. From there, though, Ricky Ponting and Andrew Symonds launched an astonishing counterattack, adding 237 for the fourth wicket at better than a run a ball. Sri Lanka were shell-shocked and capitulated meekly, and in the next match ran into a genius called Adam Gilchrist, who made a target of 267 look anything but challenging.
Sri Lanka don't have a great win-loss record against Australia at the two venues that will host the finals: it's 0-3 in Brisbane and 1-6 at the Adelaide Oval. Along with Perth, they're the worst venues for Sri Lanka in Australia. On the other hand, at the MCG and in Sydney, they have a much better 10-15 win-loss record against Australia. However, they can take much comfort from their recent record against Australia in Australia: since February 29, 2008, they've won six and lost only two of eight matches. No other team has won more ODIs against Australia in Australia during this period. That should give them confidence before the best-of-three finals.
*13:42 GMT, March 3: The article had stated that Dinesh Chandimal was the tournament's leading run-scorer so far. This has been corrected.
S Rajesh is stats editor of ESPNcricinfo. Follow him on Twitter