Toss could be key in battle of equals
India have won most of their matches against Sri Lanka at home, but Sri Lanka have the better record in World Cups and in finals
Madhusudhan Ramakrishnan
01-Apr-2011
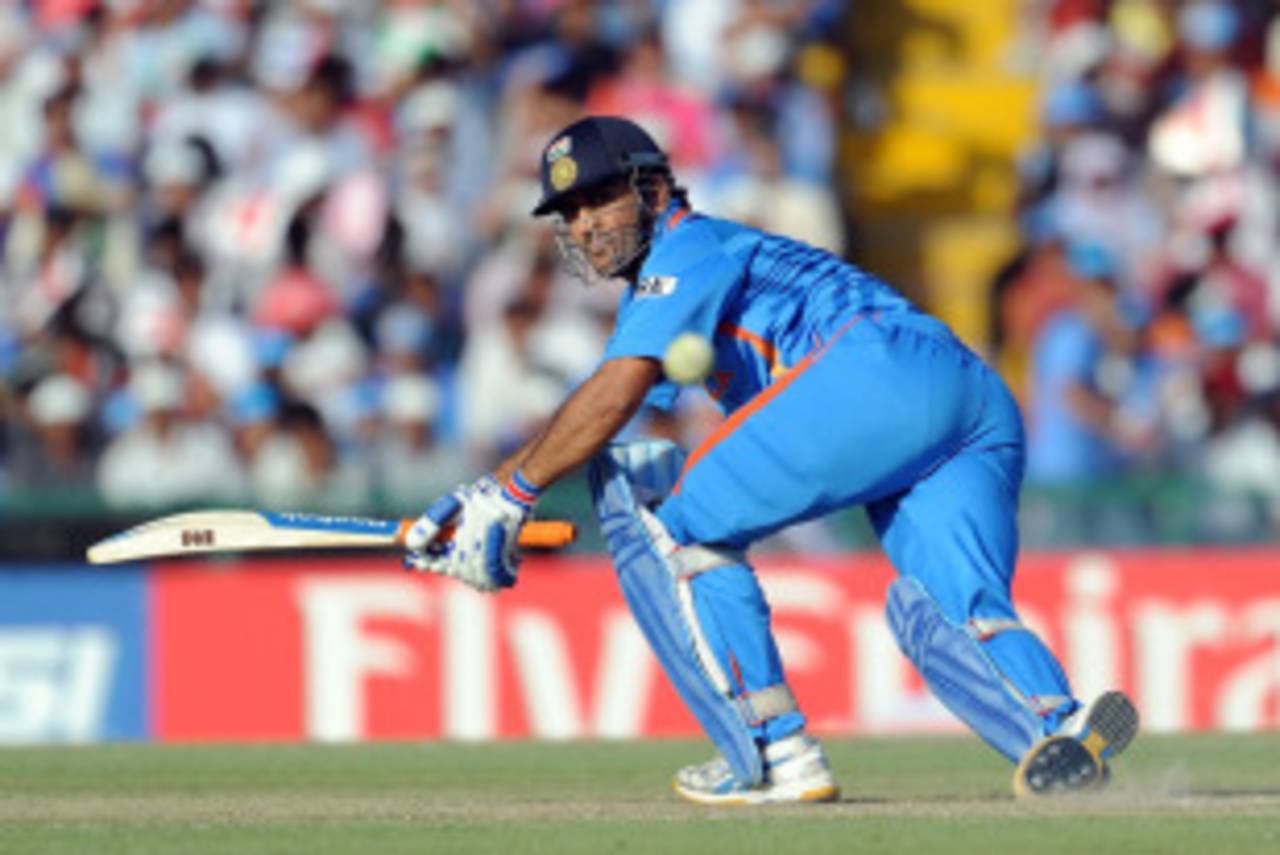
MS Dhoni: most prolific Indian batsman against Sri Lanka since 2008 • AFP
A familiar opponent
It's the third World Cup final for the two teams, but India v Sri Lanka is a fixture that has been played out on several occasions over the last three years - 33 times since the beginning of 2008, which is the highest number of ODIs between any two teams. If the results of those matches is any indication, then India have a slight advantage, having won 18 and lost 13. Only five of those matches were in India, though, with the home team winning three and losing one.
It's the third World Cup final for the two teams, but India v Sri Lanka is a fixture that has been played out on several occasions over the last three years - 33 times since the beginning of 2008, which is the highest number of ODIs between any two teams. If the results of those matches is any indication, then India have a slight advantage, having won 18 and lost 13. Only five of those matches were in India, though, with the home team winning three and losing one.
However, the win-loss numbers look quite different for matches played in India since 2000: Sri Lanka have a 3-11 win-loss record against India in India, which suggests home advantage will be a major bonus for MS Dhoni and Co on Saturday. A look at those results also shows a heavy skew in favour of the team chasing - 11 out of 14 results have gone in favour of the team batting second, while nine out of India's 11 wins have come in chases.
Sri Lanka's advantage, though, is that this is a World Cup final, and they've more often than not outperformed India in World Cups and in finals: in the 11 times they've met in a tournament decider since 2000, Sri Lanka have won seven and lost only two (with the two Champions Trophy finals in 2002 being rained out). More importantly, eight out of nine times, the team batting first has won. Admittedly, none of those finals have been played in India, where the home team have won so many times chasing, but in the final of the biggest tournament in cricket, batting first could again be a significant advantage.
The teams have met six times in World Cups, including twice the last time the tournament was held in the subcontinent in 1996. Sri Lanka won both their matches against India, in Delhi and Kolkata, quite convincingly. India, however, won by huge margins in the clashes in the 1999 and 2003 World Cups which were held in England and South Africa. The most recent World Cup meeting was in the group stage in 2007, when India lost and were dumped out of the tournament. Again, the last four World Cup matches between the two teams have all been won by the team batting first.
| Played | India | Sri Lanka | W/L ratio | |
| Overall | 128 | 67 | 50 | 1.34 |
| Since 2000 | 66 | 33 | 27 | 1.22 |
| In India since 2000 | 16 | 11 | 3 | 3.66 |
| Since 2008 | 33 | 18 | 13 | 1.38 |
| Tournament final since 2000 | 11 | 2 | 7 | 0.29 |
| In World Cup | 6 | 2 | 4 | 0.50 |
Route to the final
With their group match against Australia being abandoned, Sri Lanka enjoyed a fairly easy passage to the quarter-finals. In the quarter-final against England, they hardly broke sweat in a crushing ten-wicket win. New Zealand provided a better fight in the semi-final and tested Sri Lanka's middle order, which hasn't had much to do all tournament.
With their group match against Australia being abandoned, Sri Lanka enjoyed a fairly easy passage to the quarter-finals. In the quarter-final against England, they hardly broke sweat in a crushing ten-wicket win. New Zealand provided a better fight in the semi-final and tested Sri Lanka's middle order, which hasn't had much to do all tournament.
In sharp contrast, India came through in far more difficult circumstances from their group. After a tie and a loss against England and South Africa, they comfortably got past West Indies to reach the last eight. Yuvraj Singh and Suresh Raina guided India home in a tight chase against Australia and superb bowling was the key in the 29-run win over Pakistan in the semi-final in Mohali. Sri Lanka have been extremely dominant in the matches they have batted first. They have scored at over six runs per over and have conceded just 4.17 runs per over. India, despite not being as convincing as Sri Lanka, have also proved to be quite a handful in the last two matches when they have batted first against West Indies and Pakistan.
Although they won both their knockout matches in chases, Sri Lanka's only loss has also come when they faced a far more competitive target against Pakistan. India, who did not face a serious challenge in a chase in the group games, came through a close game against Australia. Despite no big contributions, the top order were involved in smaller meaningful stands which helped overhaul the target of 261. Sri Lanka have averaged higher and scored quicker than India but that is primarily because of their annihilation of England in the quarter-finals.
| Team | Played | Wins | Losses | Runs/wicket(batting) | RR | Runs/wicket(bowling) | ER | 100s/50s |
| India (batting first) | 5 | 3 | 1 | 35.62 | 5.85 | 30.45 | 5.52 | 5/6 |
| Sri Lanka (batting first) | 4 | 3 | 0 | 42.80 | 6.18 | 15.43 | 4.17 | 4/4 |
| India (chasing) | 3 | 3 | 0 | 44.13 | 5.08 | 25.23 | 4.53 | 0/5 |
| Sri Lanka(chasing) | 4 | 3 | 1 | 57.53 | 5.53 | 26.21 | 4.49 | 2/4 |
| India (overall) | 8 | 6 | 1 | 37.82 | 5.80 | 28.51 | 5.15 | 5/11 |
| Sri Lanka(overall) | 8 | 6 | 1 | 48.32 | 5.70 | 21.07 | 4.37 | 6/8 |
The openers for both teams have been in top form and have ensured a fast scoring rate in the first 15 overs. Sri Lanka, by virtue of two 200-plus opening stands have maintained a higher average but have scored at s slightly lower run-rate than India. However, in terms of the bowling in the same period, Sri Lanka have picked up more wickets and have been more economical. In the middle overs (16-40), both teams are evenly matched, but again Sri Lanka's spinners have been more successful at stifling the scoring rate. A few batting collapses in the final overs of the innings in group matches have dragged India's average and scoring rate down. On the bowling front, India have picked up more wickets, but the brilliant late-over bowling of Malinga and the spinners have made Sri Lanka an extremely difficult side to score off in the final ten overs.
| Team | Period(overs) | RR | Batting Avg | ER | Bowling Avg | RR diff |
| India | 0-15 | 6.14 | 61.41 | 4.94 | 74.12 | 1.20 |
| Sri Lanka | 0-15 | 5.25 | 78.87 | 4.04 | 35.41 | 1.21 |
| India | 16-40 | 5.24 | 60.64 | 4.90 | 30.62 | 0.34 |
| Sri Lanka | 16-40 | 5.41 | 92.60 | 4.29 | 22.25 | 1.12 |
| India | 41-50 | 6.94 | 14.68 | 6.31 | 14.10 | 0.57 |
| Sri Lanka | 41-50 | 7.86 | 17.09 | 5.87 | 10.05 | 1.99 |
Comparing the bowlers
Zaheer Khan, the leading wicket-taker for India in the World Cup so far, is also their most successful fast bowler in ODIs against Sri Lanka since the start of 2008. His record against both right-handers and left-handers is quite impressive. Zaheer has dismissed Tillakaratne Dilshan five times and Upul Tharanga four times in the same period. Tharanga, who is in prime form in the tournament, has especially struggled, averaging just 16.50 and scoring at 3.60 runs per over against Zaheer. Harbhajan Singh has excellent numbers too, and has conceded just over 25% of his runs in boundaries. Despite Kumar Sangakkara scoring at 5.62 runs per over off Harbhajan, he has dismissed Sangakkara five times.
Zaheer Khan, the leading wicket-taker for India in the World Cup so far, is also their most successful fast bowler in ODIs against Sri Lanka since the start of 2008. His record against both right-handers and left-handers is quite impressive. Zaheer has dismissed Tillakaratne Dilshan five times and Upul Tharanga four times in the same period. Tharanga, who is in prime form in the tournament, has especially struggled, averaging just 16.50 and scoring at 3.60 runs per over against Zaheer. Harbhajan Singh has excellent numbers too, and has conceded just over 25% of his runs in boundaries. Despite Kumar Sangakkara scoring at 5.62 runs per over off Harbhajan, he has dismissed Sangakkara five times.
Sri Lanka have gone in with Lasith Malinga and three spinners for most matches, but based on performances against India, they might be tempted to go with Nuwan Kulasekara as a second seamer. Since 2008, he has picked up 33 wickets in ODIs against India with two four-wicket hauls. He has troubled Gautam Gambhir the most, picking up his wicket six times. His accuracy and experience could be vital at the start of the Indian innings against Virender Sehwag, whom he has dismissed five times. Even though Muttiah Muralitharan, who is just three wickets away from equalling Glenn McGrath's record for the most wickets in World Cups, has not been as big a threat in recent ODIs against India, he has been the most successful bowler against them in ODIs. Ajantha Mendis has created problems for the Indian middle order, and especially for Yuvraj Singh, who he has dismissed four times in 80 deliveries conceding only 54 runs.
| Bowler | Wickets | Boundary% | Avg,ER (right handers) | Avg,ER(left handers) |
| Zaheer Khan | 26 | 47.96 | 27.41, 4.65 | 32.78, 4.95 |
| Harbhajan Singh | 26 | 25.16 | 27.66, 4.36 | 20.57, 4.53 |
| Ashish Nehra | 14 | 54.28 | 42.77, 6.43 | 46.80, 6.02 |
| Yuvraj Singh | 11 | 26.77 | 33.42, 4.61 | 36.75, 5.25 |
| Nuwan Kulasekara | 33 | 52.91 | 36.11, 4.90 | 24.80, 5.40 |
| Muttiah Muralitharan | 16 | 28.37 | 43.22, 4.54 | 46.14, 5.10 |
| Ajantha Mendis | 28 | 38.39 | 26.55, 4.87 | 22.00, 4.69 |
| Lasith Malinga | 13 | 42.41 | 43.22, 5.36 | 47.75, 6.12 |
Clash of in-form batting line-ups
MS Dhoni, who has endured a lean patch of late, has been India's most prolific run-getter in ODIs against Sri Lanka since 2008. Sehwag, who has scored at an excellent rate against both pace and spin, has scored a remarkable 68% of his runs in boundaries. Sachin Tendulkar, who passed 400 runs in a World Cup for the third time in his career, has scored a century and two fifties in five World Cup matches against Sri Lanka. His 138 in the Compaq Cup final in Colombo in 2009 gave India a 46-run win. He has scored at just over five runs per over off the fast bowlers, but has been far more aggressive against the spinners, scoring at over seven runs per over.
MS Dhoni, who has endured a lean patch of late, has been India's most prolific run-getter in ODIs against Sri Lanka since 2008. Sehwag, who has scored at an excellent rate against both pace and spin, has scored a remarkable 68% of his runs in boundaries. Sachin Tendulkar, who passed 400 runs in a World Cup for the third time in his career, has scored a century and two fifties in five World Cup matches against Sri Lanka. His 138 in the Compaq Cup final in Colombo in 2009 gave India a 46-run win. He has scored at just over five runs per over off the fast bowlers, but has been far more aggressive against the spinners, scoring at over seven runs per over.
Dilshan and Sangakkara, who are among Sri Lanka's leading run scorers in the World Cup, have also been their best batsmen in ODIs against India. Dilshan's stunning 160 in Rajkot in 2009 nearly helped Sri Lanka chase down a massive 414. Sangakkara, despite having a few problems against Harbhajan, has been a picture of consistency in matches against India. Mahela Jayawardene has not been very successful against India, though, averaging just under 33. He hasn't scored a century against them since 2008. Tharanga, who has scored two centuries in this World Cup, has also been subdued in recent ODIs against India and averages just over 30.
| Batsman | Runs | Boundary% | Avg,RR(pace) | Avg,RR(spin) |
| MS Dhoni | 1217 | 34.01 | 48.33, 5.20 | 70.77, 4.80 |
| Gautam Gambhir | 899 | 44.49 | 43.06, 5.33 | 63.25, 5.40 |
| Virender Sehwag | 750 | 67.73 | 40.13, 7.43 | 148.00, 8.29 |
| Sachin Tendulkar | 529 | 48.77 | 43.11, 5.17 | 47.00, 7.16 |
| Tillakaratne Dilshan | 1160 | 57.24 | 39.47, 6.15 | 55.16, 5.01 |
| Kumar Sangakkara | 1104 | 43.84 | 38.00, 4.81 | 45.09, 5.70 |
| Mahela Jayawardene | 789 | 32.95 | 35.00, 4.25 | 33.40, 4.52 |
| Upul Tharanga | 425 | 54.58 | 41.71, 5.13 | 22.16, 4.66 |
Venue stats
The highest score chased successfully under lights at the Wankhede Stadium is 225. Sri Lanka overhauled that total, made by India, to win by five wickets in 1997. In ten day-night games here, the team batting second has won four times, with India successfully chasing down targets on their last two attempts, against Australia and South Africa. In this World Cup, the team batting first has won both games here, with Sri Lanka being extremely impressive in their 112-run thrashing of New Zealand.
The highest score chased successfully under lights at the Wankhede Stadium is 225. Sri Lanka overhauled that total, made by India, to win by five wickets in 1997. In ten day-night games here, the team batting second has won four times, with India successfully chasing down targets on their last two attempts, against Australia and South Africa. In this World Cup, the team batting first has won both games here, with Sri Lanka being extremely impressive in their 112-run thrashing of New Zealand.
In recent ODIs, the track has proved to be more advantageous to spinners. In matches since 2000, spinners average 26.41 runs per wicket, and that average drops to 22.70 in the second innings.
| Bowler Type | Wickets | Average | ER | 4+W |
| Pace | 57 | 29.56 | 5.12 | 2 |
| Spin | 39 | 26.41 | 4.59 | 4 |