Were the pitches tougher to bat on in the 2023 India-Australia series or the 2017 one? Here's what the data says
Looking at pitching lines and lengths for offspinners against right-hand batters tells a story
Kartikeya Date
13-Apr-2023
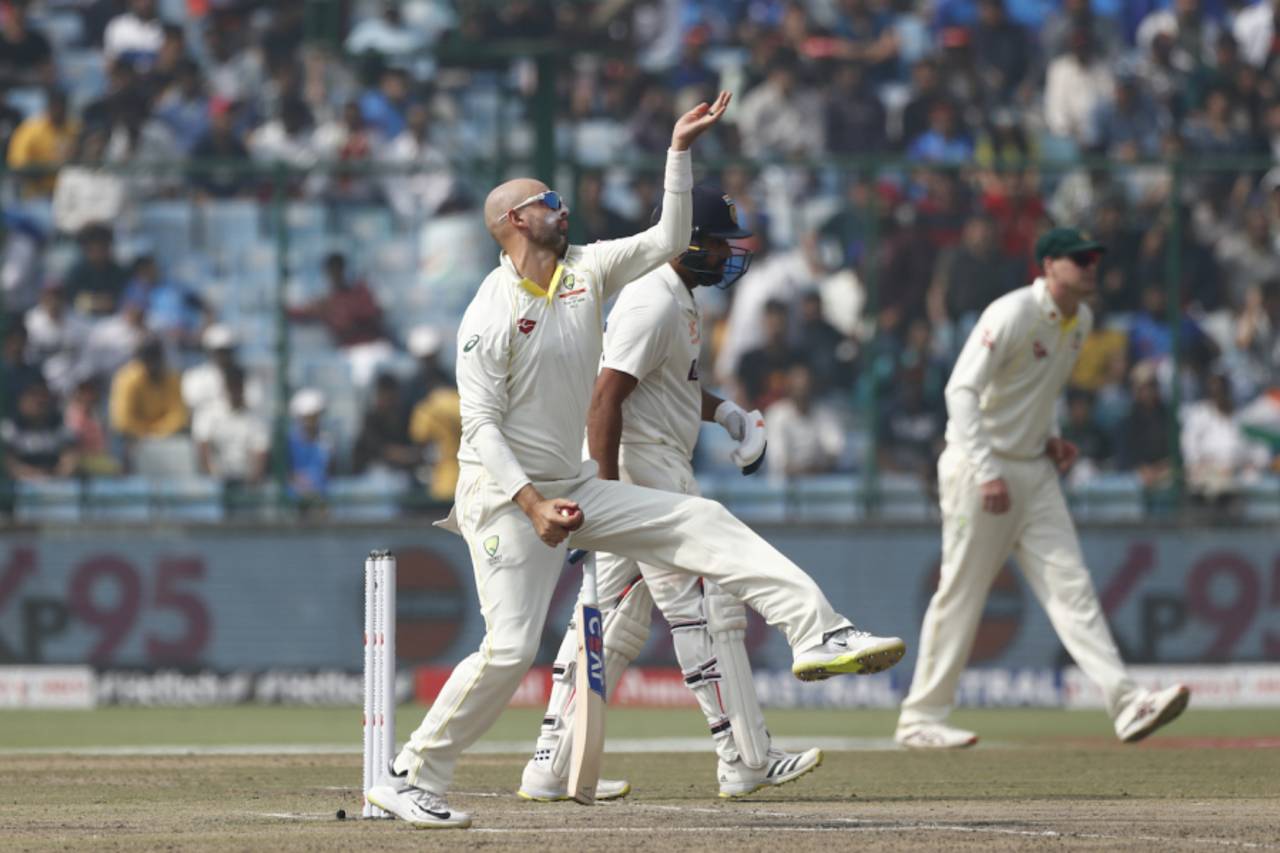
By bowling around the wicket, offspinners were able to target right-handers' stumps more effectively in the 2023 India-Australia series • Pankaj Nangia/Getty Images
Australia toured India for four Tests each in 2017 and 2023 and lost 1-2 both times. On its website, the BCCI publishes scorecards and ball-tracking records for each ball of these series (and others). Readers can look up any ball in a recent Test, ODI, T20I or IPL match played in India, one at a time.
These records make available the pitching point (line and length of the delivery), interception point (the point at which the ball hit the bat, pad or a part of the batter's body, if at all), and the beehive point (the point at which the ball would have crossed, or did cross, the plane of the stumps). Additionally, the ball-tracking record provides measures of turn, seam movement and speed, among others. This is a treasure trove of information made available by the BCCI.
ESPNcricinfo records a control measurement for each delivery. This is an answer (either yes or no) to the question "Did the ball end up where the batter intended?" This article uses these two types of records - ball-tracking and control - to describe the contest between offspinners and right-hand batters in the 2017 and 2023 series.
Pitch maps showing the pitching points and interception points for balls bowled by offspinners to right-hand batters in the two series are in the graphs above and below.
First impressions suggest that the line of attack was straighter in 2023, mostly because the offspinners bowled around the wicket to right-handers most of the time. These distinctions are also shown in the table below. (This table includes all deliveries by offspinners to right-hand batters in these two series for which complete ball-tracking records (pitching, interception, beehive) are available. Records are not complete for 103 balls in the 2017 series and 36 balls in the 2023 series; 15 false shots and one dismissal in 2017 and six false shots and 0 dismissals in 2023 are consequently missed in this record.)
The effect of the change from over-the-wicket (predominant in 2017) to round the wicket (predominant in 2023) is evident most clearly in comparing balls of type B (not hitting the stumps, intercepted in line), and balls of type C (hitting the stumps, intercepted outside the line). While the frequency of false shots against type B was nearly double that of type C in both series, the conversion of false shots to dismissals was reversed. In 2017, getting outside the line meant safety for the right-hander against the offspinner. In 2023, it didn't.
The eight pitches did not offer assistance to the spinners and seamers equally. The characteristics of each pitch, as rendered by the control figures, are in the tables below. Pitches offered different degrees of turn, bounce, and variability in bounce.
The pitch in Indore was the most difficult of those in the two series because it offered generally low bounce that was highly uneven. By comparison, the Bengaluru pitch from 2017 also offered significant variable bounce to the fingerspinners, but the ball generally bounced more there. The Bengaluru pitch was probably not easier to bat on compared to the Indore one, but it was easier for the spinner to threaten the stumps in Indore. Nathan Lyon's eight-wicket haul in the first innings in Bengaluru included six caught dismissals. His eight-wicket haul in Indore included six bowled or leg-before-wicket dismissals.
The tables suggest that five - Pune, Bangalore, Nagpur, Indore and Delhi - of the eight pitches could be considered spin-friendly and the other three might be considered less so, with reliable bounce and moderate turn. Batters managed a false shot once every 5.7 balls or better against fingerspin in these three Tests.
The graphs above and below show the interception points for right-hand batters facing offspinners in the 2017 and 2023 Border Gavaskar Trophy Tests. The one above shows the distribution of false shot rates according to interception points in Dharamsala, Ranchi and Ahmedabad. The second graph below shows the same for Pune, Bangalore, Nagpur, Delhi and Indore. The batting crease in the graphs is at 1.2m and the stumps are at 0.0m.
For the most part, batters try to play forward (they meet the ball at at least 2.3m from the stumps), or back. These are also the interception points at which the batter is most assured.
On the flat pitches, as long as the batter read the length against the offspinner and got forward or back, the jeopardy was minimal (false shots occur at a rate of between one in 20 balls and one in ten balls). But when the batter was beaten in the flight, the jeopardy increased (false shots occur at a rate of between one in seven balls and one in four balls). This is probably what players are describing when they say that they can "trust the pitch"; the spinner has to beat the bat in the air in these cases.
On the turning pitches, batters were beaten not just in the air but also off the pitch. So even when the batter met the ball with a full forward stroke, or playing well back, the jeopardy hovered above a rate of one false shot every eight balls (about 12%), and climbed to one every three balls or so when the batter was beaten in the air as well. Batting becomes significantly more difficult on pitches of this sort.
At this point, it is worth wondering whether a batter's judgement of length is affected by the behaviour of the pitch. In other words, does the fact that the batter cannot trust the pitch affect judgement of length?
The graphs above and below show the range of lengths by interception points on the turners and the flat pitches in the India-Australia series. Consider that all the deliveries from an offspinner that the right-hand batter intercepts at a distance of two metres from the stumps are arranged from the fullest to the shortest delivery. This range of lengths is described in the graphs using three values - the median length, the length of the delivery at the 10th percentile in the list, and the length of the delivery in the 90th percentile in the list. For instance, for interception point 0.8 in the graphic above, 50% of the balls were around five metres or fuller, 10% were 4.3m or fuller, and 90% were 7.4m or fuller.
As readers will probably expect, the range of lengths to which the batter plays well forward or back is narrower than the range of lengths for which the batter is caught in between. But there is no discernible difference in the distribution of lengths to which batters play forward or back based on the amount of assistance offered by the pitch. The record does not support the idea that a turning pitch disrupts the batter's judgment of length. It does make pretty much all lengths more difficult to play. If anything, there is some evidence going the other way - that batters are able to, and do, take more liberties with the length on flatter pitches compared to turners.
By bowling around the wicket, offspinners in the 2023 series were able to overpitch less often - their average length was 4.84m, 8.2 inches shorter than in 2017. They were also able to attack the stumps more, and give the right-hand batter fewer scoring opportunities through the off side compared to 2017. On the whole, judging by the false-shot frequency, the pitches in 2017 were probably marginally more difficult to bat on than the pitches in 2023. But in 2023, both sides had deeper spin attacks than in 2017, and both sides fielded five bowlers when they could (Australia did as soon as Cameron Green became available). Consequently, the scores were lower.
As illustrated in this article through a discussion of offspin bowling against right-hand batters, the ball-by-ball record, combined with control, provides a picture of the contest between bat and ball that is not available from the traditional scorecard. The scorecard directs our attention to dismissals. Consequently a lot of analysis and discussion in cricket is focused on deliveries which result in dismissals. Largely these deliveries just happen to be ones on which dismissals occur; they could just as likely have occurred on several other deliveries. A genuinely comparative picture of the two contesting teams in a cricket match would consider which team threatened dismissal more persistently than the other in the field. This type of discussion is only possible with data.
International teams already use a far more elaborate record of each delivery while preparing for matches, and often with live data feeds during matches. Some basic portion of this data should be published by cricket boards in the public domain. It will be welcomed by fans, and it will enable a textured reading of the skilled labour of batting and bowling rather than the headline outcomes provided in traditional scorecards.
The interception distance from the stumps has been calculated by Himanish Ganjoo. I'm grateful for his help
Kartikeya Date writes the blog A Cricketing View. @cricketingview