A smashing start to T20Is in 2018
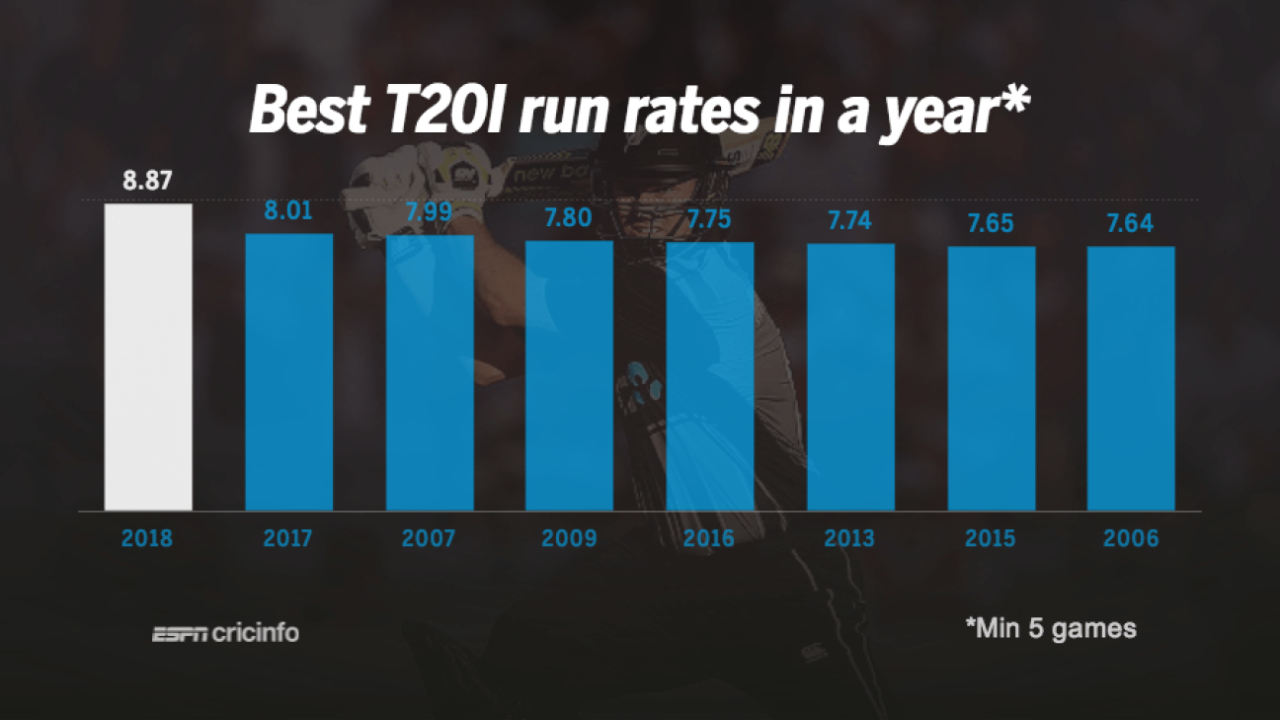
The average T20I run rate in 2018 so far is 8.87, the highest among all years so far
S Rajesh
23-Feb-2018
ESPNcricinfo Ltd
The year 2018 is less than two months old, but already there has been frenetic T20I action around the world. New Zealand has been the hub, hosting bilateral series against West Indies and Pakistan, plus the Trans-Tasman tri-series, also featuring Australia and England. Sri Lanka have played in Bangladesh and Zimbabwe, Afghanistan in the UAE, and India in South Africa.
That adds up to 18 T20Is in 2018 already, and the standout feature in these games so far has been the scoring rate: the average run rate so far is 8.87, which is easily the highest among all calendar years. The next highest, among all years that have had at least five matches, is 8.01, in 2017. (In 2005, only three matches were played, in which the run rate was 8.11.) When considering only matches played between the top eight teams (because the scoring rates involving other teams often tend to be lower), the run rate this year goes up to 8.99, which is again the highest among all years. In this case, though, there are other years when the rate was over 8 - the next best is 8.54, in 2015, followed by 8.27 in 2007.
| Year | Mat | Ave | Run rate |
| 2018 | 14 | 27.37 | 8.99 |
| 2015 | 16 | 24.50 | 8.54 |
| 2007 | 24 | 24.39 | 8.27 |
| 2013 | 24 | 26.39 | 8.25 |
| 2016 | 43 | 25.69 | 8.11 |
| 2017 | 32 | 22.89 | 8.00 |
It is clear that the small grounds and good pitches in New Zealand have had a role to play in the higher run rate in 2018: nine of the 18 T20I matches this year have been played in New Zealand (including one no-result), and the average run rate in these games has been 9.27. Four times teams have exceeded 200, while there have been three totals between 190 and 199.
However, a look at earlier games in New Zealand reveals that these rates aren't normal even in New Zealand. In T20I games between the top eight teams in New Zealand between 2014 and 2017, the average scoring rate was 8.46, which means this year the run rate has gone up by almost 10%.
| Year | Mat | Ave | Run rate | BpB |
| 2018 | 9 | 27.64 | 9.27 | 5.3 |
| 2014-17 | 9 | 23.94 | 8.46 | 5.7 |
The over-wise run-rate comparison between this year and the last two years indicates how much more firepower has been on display so far this year. Out of 20 overs, in only four overs is the run rate this year lower than in the last two years: in the fourth, eighth, 14th and 18th. In the 19th over, the rate is the same. However, this year so far there are six overs in which the average rate is greater than 10 runs an over: third (10.03), fifth (10.59), sixth (10.14), 16th (10.37), 17th (11.25), and 20th (12.66). In the last two years, only in the 20th over did the average run rate go beyond ten an over.
In terms of scoring patterns, the balls-per-boundary stat has shown the biggest improvement this year, thanks to the shorter boundaries in New Zealand. A four or a six has been hit every 5.4 balls this year, compared to once every 6.3 balls in 2016 and 2017. That is an improvement of more than 14%. Within the three blocks of overs (Powerplays, middle overs and last five), the biggest difference has been in the last five, with the balls-per-boundary figure jumping from 5.7 to 4.7, an improvement of 17.5%.
| Over range | Run rate | Dot % | BpB | RPSS^ |
| 0.1 to 6.0 | 9.10 | 44.4 | 4.3 | 2.6 |
| 6.1 to 15.0 | 8.24 | 32.0 | 7.2 | 1.9 |
| 15.1 to 20.0 | 10.50 | 28.7 | 4.7 | 2.3 |
| Over range | Run rate | Dot % | BpB | RPSS |
| 0.1 to 6.0 | 8.01 | 47.2 | 5.1 | 2.4 |
| 6.1 to 15.0 | 7.56 | 33.5 | 8.1 | 1.8 |
| 15.1 to 20.0 | 9.25 | 31.0 | 5.7 | 2.1 |
The top five run scorers so far in T20Is this year have all played largely in New Zealand, and all of them have strike rates in excess of 140. Over the rest of the year, matches in other venues like Sri Lanka and the UAE could well bring the overall strike rates down, but given the general direction in which this format is going, 2018 could be the year that finishes with the highest T20I strike rate of them all so far.
| Player | Inns | Runs | Ave | SR | BpB |
| MJ Guptill (NZ) | 10 | 410 | 41.00 | 146.95 | 5.6 |
| C Munro (NZ) | 9 | 396 | 49.50 | 193.17 | 3.4 |
| GJ Maxwell (AUS) | 5 | 233 | 116.50 | 166.42 | 4.5 |
| DJM Short (AUS) | 5 | 196 | 49.00 | 149.61 | 4.5 |
| DJ Malan (ENG) | 4 | 172 | 43.00 | 140.98 | 5.3 |
S Rajesh is stats editor of ESPNcricinfo. @rajeshstats.