The most result-oriented countries and venues
South Africa has been an excellent country for Test matches that end decisively, but the same cannot be said for Pakistan or West Indies
S Rajesh
11-Dec-2009
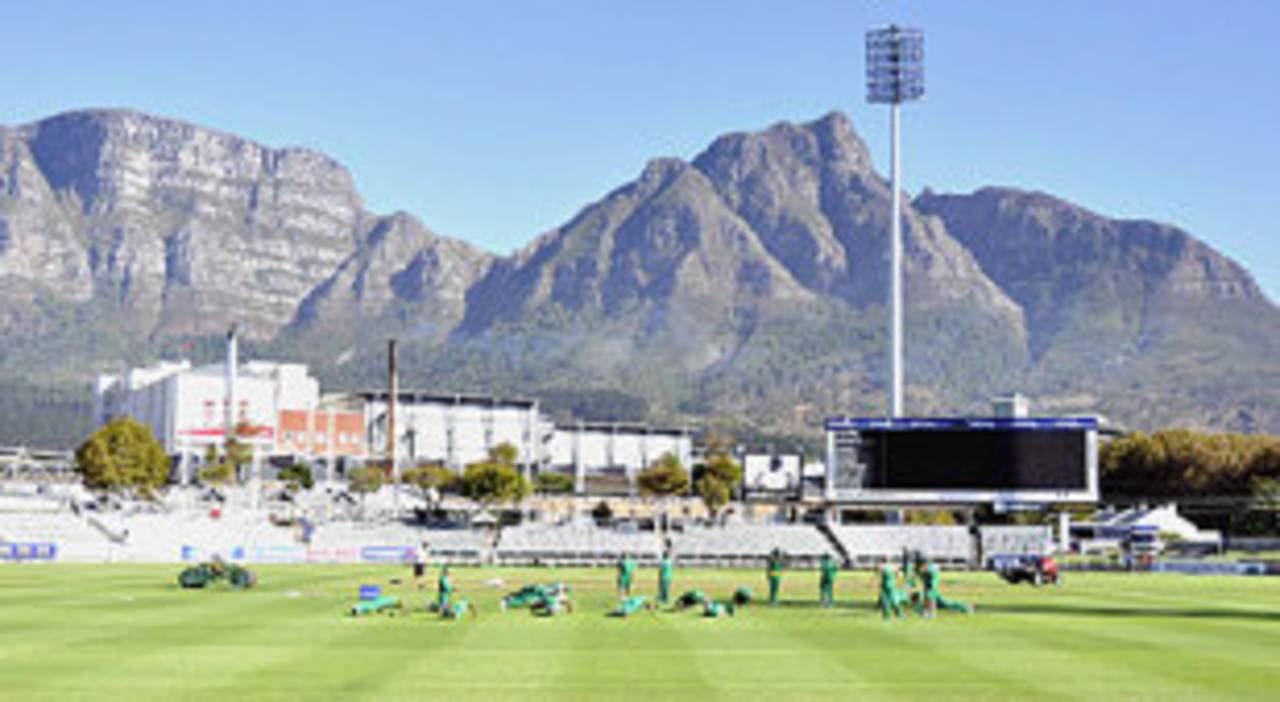
Newlands in Cape Town hosted the last drawn Test in South Africa, way back in 2006. Since then, 17 Tests have all yielded decisive results • Getty Images
Plenty of voices have been raised recently over the future of Test cricket, but over the last month the format has been shown in excellent light. New Zealand and Pakistan have played exciting matches (both of which have ended decisively), Australia and West Indies were involved in a lopsided result game (Brisbane) and a tense draw (Adelaide), while India triumphed convincingly in two out of three home Tests against Sri Lanka. Five results in seven matches and one close draw indicates the longest format is in pretty good health, with plenty to look forward to in the five remaining Tests for the year.
Overall in 2009 so far, though, draws have accounted for a fairly high percentage - out of 36 matches, 13 have been stalemates, which represents 36% of all Tests. If the last five Tests all produce results, the percentage will drop to 32, but it'll still remain higher than the average of the last five years: since 2005, 57 out of 209 matches have been drawn - a percentage of 27.
Digging deeper, it's clear that some countries have played out stalemates far more often than others. Among countries that have hosted more than five Tests, four have a draw percentage of less than the overall average, while five exceed the 27% mark. Leading the way is Pakistan, with seven draws in 13 Tests, the only country with more draws than results during this period. West Indies and India follow closely, with draw percentages of more than 40, though India's record has improved slightly after their two successive wins against Sri Lanka.
At the other end of the scale are South Africa and Australia, with draw percentages of less than 20. In 27 Tests in South Africa in the last five years, only two have been drawn - against England in Centurion in 2005 and against New Zealand in Cape Town in April 2006. Since then, South Africa have hosted 17 Tests that have all yielded decisive results. Australia has witnessed only three draws in 26 games, with Adelaide hosting two of them, and Perth one.
The runs-per-wicket stat in each country presents interesting numbers too - Australia's is pretty high at 36.37, and yet most of the matches there have yielded results. An average of 36.37 runs at 3.34 per over indicates that 10 wickets fall in about 109 overs, which still leaves enough time for teams to force a result. In New Zealand, on the other hand, the average is only 31.88, and yet one in three Tests there is drawn. One reason is probably the weather, but another factor could be the extremes in pitch types there - some tracks are batting beauties that produce run-fests, while others result in extremely low-scoring matches.
| Host country | Tests | Results/ Draws | Draw % | Runs per wkt | Runs per over | Decade draw % |
| Zimbabwe | 4 | 4/ 0 | 0 | 27.89 | 3.57 | 18 |
| South Africa | 27 | 25/ 2 | 7 | 30.42 | 3.32 | 13 |
| Australia | 26 | 23/ 3 | 11 | 36.37 | 3.34 | 15 |
| Sri Lanka | 22 | 18/ 4 | 18 | 32.18 | 3.34 | 20 |
| Bangladesh | 14 | 11/ 3 | 21 | 32.09 | 3.15 | 13 |
| New Zealand | 22 | 15/ 7 | 31 | 31.88 | 3.19 | 29 |
| England | 35 | 24/ 11 | 31 | 34.91 | 3.52 | 24 |
| India | 24 | 14/ 10 | 41 | 39.80 | 3.31 | 38 |
| West Indies | 22 | 12/ 10 | 45 | 37.36 | 3.22 | 39 |
| Pakistan | 13 | 6/ 7 | 53 | 44.60 | 3.51 | 31 |
Taking a wider span, the last decade, and a cut-off of eight Tests, it emerges that the best venue for bowlers is Sabina Park in Kingston, an anomaly in a region that is otherwise a haven for featherbeds. In 10 Tests there, only 14 centuries have been scored, and batsmen have averaged a mere 24.50 per wicket. Thirteen times teams have been dismissed for less than 200 in these matches, with the most recent game there resulting in England being bowled out for 51, five years after they'd battered West Indies for 47 at the same ground.
The Basin Reserve in Wellington, where Mohammad Asif and Co caused so much grief for New Zealand last week, is in seventh place, but it leads in terms of the fewest hundreds per Test, with an average of one century per match. Centurion, the venue for England's first Test against South Africa, is in the top 10 as well, suggesting that bowlers might have something to cheer for in the match coming up there as well.
| Venue | Matches | Runs | Average | 100s/ 50s | 100s per Test |
| Sabina Park, Kingston | 10 | 8480 | 24.50 | 14/ 40 | 1.40 |
| Bangabandhu Stadium, Dhaka | 9 | 7071 | 26.09 | 8/ 39 | 0.89 |
| Asgiriya Stadium, Kandy | 13 | 11,255 | 27.12 | 17/ 48 | 1.31 |
| Wanderers, Johannesburg | 10 | 9142 | 27.87 | 15/ 36 | 1.50 |
| Trent Bridge, Nottingham | 9 | 8483 | 28.08 | 13/ 43 | 1.44 |
| Seddon Park, Hamilton | 8 | 6975 | 28.46 | 15/ 30 | 1.88 |
| Basin Reserve, Wellington | 14 | 12,380 | 28.92 | 14/ 67 | 1.00 |
| Port of Spain, Trinidad | 8 | 7995 | 28.96 | 21/ 29 | 2.63 |
| Supersport Park, Centurion | 10 | 8656 | 29.14 | 17/ 34 | 1.70 |
| MA Aziz Stadium, Chittagong | 8 | 7131 | 29.46 | 12/ 30 | 1.50 |
Meanwhile, the venues listed below have far more pleasant memories for batsmen - all these grounds have produced several run-feasts over the last decade. St John's in Antigua has seen four draws in a row in its most recent Tests, and seven 500-plus totals in eight matches since 2000. Twenty-six centuries have been scored here - including the highest individual score in Test cricket - so it's only fitting that St John's should head the table for highest average. What's more surprising is the presence of the WACA in this table - with an average of 34, and 17 hundreds in nine Tests, it's clearly not as bowler-friendly as it used to be.
Reduce the qualification to five Tests, though, and there's a new leader - McLean Park in Napier, the venue for the third Test between New Zealand and Pakistan. If the pitch plays to reputation, there could be some celebration for two beleaguered batting teams over the next five days.
| Venue | Matches | Runs | Average | 100s/ 50s | 100s per Test |
| St John's, Antigua | 8 | 9446 | 39.52 | 26/ 35 | 3.25 |
| Gaddafi Stadium, Lahore | 10 | 9732 | 38.61 | 25/ 40 | 2.50 |
| Sydney Cricket Ground | 12 | 14,064 | 36.91 | 33/ 57 | 2.75 |
| Adelaide Oval | 9 | 10,413 | 36.28 | 23/ 43 | 2.56 |
| Kennington Oval, London | 10 | 10,625 | 35.18 | 21/ 54 | 2.10 |
| National Stadium, Karachi | 8 | 9415 | 35.13 | 24/ 33 | 3.00 |
| WACA, Perth | 9 | 10,051 | 34.18 | 17/ 55 | 1.89 |
S Rajesh is stats editor of Cricinfo