Pakistan hold the aces
Pakistan's excellent record in Sri Lanka backed up by their superior all-round strength clearly makes them the favourites in the ODI series
Madhusudhan Ramakrishnan
06-Jun-2012
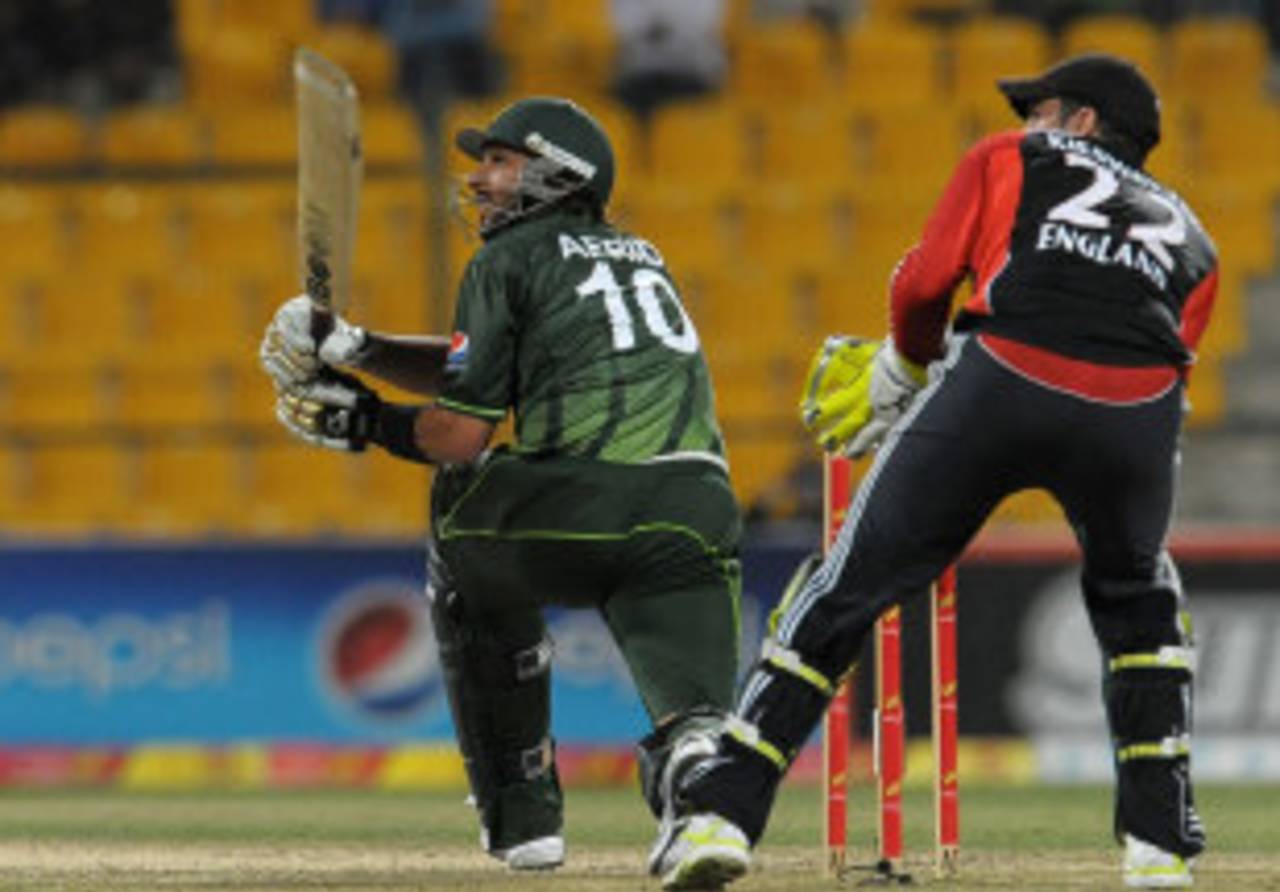
Shahid Afridi has starred with bat and ball in recent ODIs against Sri Lanka • AFP
In the last bilateral series played between Pakistan and Sri lanka, Pakistan came out comfortably on top, winning 4-1 in the UAE. The result, however, was not surprising considering Pakistan's excellent record against Sri Lanka. No other team has won as many matches against Sri Lanka as Pakistan have. In the 127 matches played between the two teams, Pakistan hold a distinct 76-47 head-to-head advantage going into the five-match ODI series. Their win-loss ratio of 1.61 against Sri Lanka is also second only to Australia's 1.89. While Pakistan have exerted complete dominance in home and neutral ODIs against Sri Lanka winning 63 matches and losing 34, the gap between the two teams in ODIs in Sri Lanka is much narrower. However, Pakistan remain the only visiting team to maintain an even win-loss record (a win-loss ratio of 1.00) against Sri Lanka in Sri Lanka.
India have played Sri Lanka more often in Sri Lanka and have won more matches than Pakistan. But Pakistan are comfortably ahead when the win-loss ratio is considered. Pakistan have won and lost 13 matches (win-loss ratio of 1.00) while India and third-placed Australia have corresponding numbers of 0.73 and 0.69 respectively. Most visiting teams have struggled to compete on the slow turners in Sri Lanka and this is reflected in the numbers. Both West Indies and England have been ordinary and have win-loss ratios of 0.50 and 0.40. South Africa's form in Sri Lanka clearly puts the problems of visiting teams in perspective. With just one win and nine losses in 11 matches, they have a very poor win-loss ratio of 0.11.
| Team | Matches | Wins | Losses | W/L ratio |
| Pakistan | 28 | 13 | 13 | 1.00 |
| India | 51 | 19 | 26 | 0.73 |
| Australia | 25 | 9 | 13 | 0.69 |
| West Indies | 11 | 3 | 6 | 0.50 |
| England | 14 | 4 | 10 | 0.40 |
| New Zealand | 20 | 5 | 13 | 0.38 |
| South Africa | 11 | 1 | 9 | 0.11 |
Since 2000, Pakistan's record against Sri Lanka in Sri Lanka has been less impressive. They have won six and lost nine matches (before 2000 they won seven and lost four). However, their batting and bowling stats illustrate how consistent they have been when compared to all other teams except Australia. In the same period, Australia have won two bilateral series in Sri Lanka (2004 and 2011). They have the best average difference (difference between the batting and bowling averages) and run-rate difference (difference between batting run-rate and economy rate) among all visiting teams. Australia's average difference of 6.42 is well ahead of second-placed Pakistan's -0.42. At the other end of the table are England and South Africa, who have corresponding numbers of -13.81 and -15.72 respectively. Pakistan and Australia are the only teams to boast a positive value of run-rate difference (0.03 and 0.19 respectively). England and South Africa are well behind on this front too with run-rate differences of -0.88 an -0.72.
* Matches against Sri Lanka only. Excludes Bangladesh and Zimbabwe
| Team | Matches | Wins/Losses | Bat avg/Bowl avg | Avg diff | Bat RR/Bowl ER | RR diff |
| Australia | 12 | 6/5 | 31.24/24.82 | 6.42 | 4.65/4.46 | 0.19 |
| Pakistan | 16 | 6/9 | 26.18/26.60 | -0.42 | 4.47/4.44 | 0.03 |
| India | 30 | 13/14 | 28.75/29.75 | -1.00 | 4.83/4.94 | -0.11 |
| West Indies | 8 | 2/5 | 27.46/34.10 | -6.64 | 4.63/4.91 | -0.28 |
| New Zealand | 9 | 1/7 | 18.62/31.12 | -12.50 | 3.81/4.41 | -0.60 |
| England | 10 | 3/7 | 19.17/32.98 | -13.81 | 3.68/4.56 | -0.88 |
| South Africa | 8 | 0/8 | 23.56/39.28 | -15.72 | 4.47/5.19 | -0.72 |
In matches played between the two teams since 2009, Kumar Sangakkara has been the highest run-getter. Sri Lanka will again rely on Sangakkara and Mahela Jayawardene for stability in an otherwise inexperienced middle order. Tillakaratne Dilshan has averaged 45.30 in the same period with a century and two fifties and will be the key to good starts for Sri Lanka given his quick scoring. Pakistan emerged easy winners the last time the teams met in 2011 and their batting has been in top form against Sri Lanka. Both Younis Khan and Misbah-ul-Haq have good averages and have scored four half-centuries each in the head-to-head matches. The firepower in the middle order, however, tilts the scales Pakistan's way. Not only do Shahid Afridi and Umar Akmal have terrific strike rates, they have also been among the runs against Sri Lanka in recent contests. While Afridi's century (109 off 76 balls), however, came in a close defeat in the Asia Cup game in Dambulla, Akmal's 102 in Colombo set up a huge win for Pakistan.
In the same period, Pakistan have completely dominated the bowling stats. The top three wicket-takers in head-to-head contests are Pakistan bowlers. Afridi, in particular, has been outstanding and has picked up 25 wickets at 25.88. With Saeed Ajmal and Umar Gul in the line-up, Pakistan definitely have the advantage. Sri Lanka, without Muttiah Muralitharan, will undoubtedly need Lasith Malinga to fire. However, Malinga has not been at his best against Pakistan in recent matches picking up 13 wickets at an average of 33.69.
| Batsman | Innings | Runs | Average | SR | 100/50 |
| Kumar Sangakkara | 16 | 598 | 39.86 | 73.46 | 0/4 |
| Mahela Jayawardene | 15 | 475 | 31.66 | 77.48 | 1/3 |
| Tillakaratne Dilshan | 11 | 453 | 45.30 | 86.94 | 1/2 |
| Upul Tharanga | 13 | 409 | 31.46 | 70.27 | 0/4 |
| Younis Khan | 15 | 496 | 35.42 | 73.69 | 0/4 |
| Umar Akmal | 11 | 470 | 52.22 | 98.94 | 1/4 |
| Misbah-ul-Haq | 11 | 357 | 44.62 | 70.27 | 0/4 |
| Shahid Afridi | 13 | 335 | 27.91 | 124.07 | 1/1 |
Pallekele, the venue for the first two matches, has hosted four ODIs so far with the team batting first coming out on top twice. Since 2010, the Premadasa stadium has hosted nine matches with the team batting first winning two and losing six. This is in sharp contrast to the stats at the venue between 2000 and 2009. In that period, the team batting first won 40 and lost just 16 matches. Both pace bowlers and spinners have better averages and economy rates in Colombo as compared to their numbers in Pallekele.
| Venue | Matches | Wins/losses (batting first) | Average/RR (bat first) | Average/RR (chasing) | Pace (avg, ER) | Spin (avg,ER) |
| Premadasa stadium, Colombo | 9 | 2/6 | 22.55/4.28 | 36.30/4.84 | 26.81/4.42 | 29.91/4.38 |
| Pallekele International Cricket Stadium | 4 | 2/2 | 32.36/5.36 | 28.30/4.81 | 27.59/5.36 | 33.04/4.68 |
Madhusudhan Ramakrishnan is a sub-editor (stats) at ESPNcricinfo