Toss key in spin-heavy contest
In a clash of two powerful bowling teams at a spin-friendly venue, the outcome of the toss could have a bearing on the result
Madhusudhan Ramakrishnan
03-Oct-2012
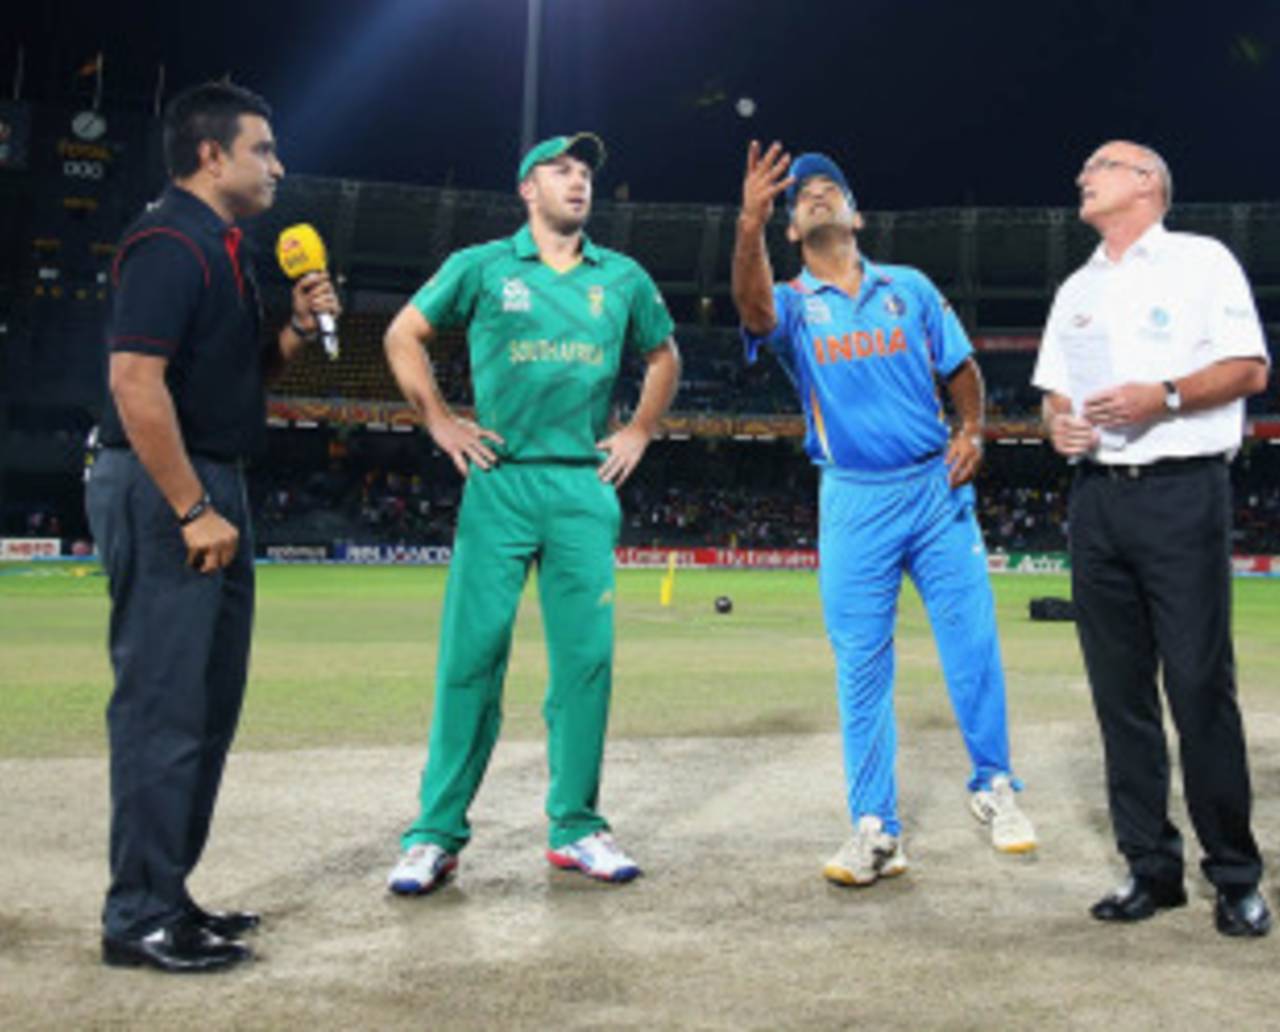
Teams winning the toss have won only one out of 11 matches played at the Premadasa stadium • ICC/Getty
In a tournament where no team has managed to stay unbeaten, the first semi-final will be contested between two of the most consistent teams in the history of the World Twenty20. Pakistan, who qualified for the semi-finals on the basis of a better net run rate than India, have defied the unpredictable nature of the format by making the last four in each of the four tournaments. Only Michael Hussey's remarkable 60 ended their hopes of making a third consecutive final in the 2010 World Twenty20. Sri Lanka, who went through the Super Eights undefeated, are the only team to come close to matching Pakistan's consistency. After a poor run in the first World Twenty20 in 2007, they made the final in 2009 and lost out to England in the semi-final in 2010. On a pitch that is increasingly aiding spin bowlers, the clash between the two sides could be decided by the performance of the slow bowlers.
Not only have Pakistan been the most successful team in Twenty20 internationals, they have also had the better of Sri Lanka in the head-to-head clashes. In three matches between the two teams in the World Twenty20, Pakistan have won two including the 2009 final at Lord's. The dominance has also extended to matches played in neutral venues (4-2) and in Sri Lanka (2-1). Pakistan have been comfortably ahead of Sri Lanka in terms of both the average difference (difference between batting and bowling averages) and run-rate difference (difference between batting run-rate and bowling economy rate). The team batting first has dominated the clashes in Sri Lanka. While the teams have won one game apiece in Hambantota, Pakistan won the only meeting at the Premadasa stadium by 52 runs.
| Wins/Losses | Bat avg/Bowl avg | Bat rr/Bowl rr | Avg diff | rr diff | |
| Overall | 6/3 | 22.15/16.52 | 7.18/6.85 | 5.53 | 0.33 |
| In Sri Lanka | 2/1 | 18.52/13.00 | 6.74/6.10 | 5.52 | 0.64 |
| Neutral Venues | 4/2 | 24.27/18.58 | 7.40/7.21 | 5.69 | 0.19 |
| In World Twenty20 | 2/1 | 27.00/20.18 | 7.82/7.40 | 6.82 | 0.42 |
Pakistan have been the best bowling side by far in the tournament. They came through a difficult group in the Super Eights that included India, Australia and South Africa. Against South Africa and Australia, they produced excellent bowling performances, restricting the opposition teams to 133 and 117 respectively. Saeed Ajmal, the highest wicket-taker in Twenty20 internationals, has been in outstanding form picking up eight wickets at an economy rate of just 6.50. Ajantha Mendis has picked up more wickets (9) but six of his wickets came in Sri Lanka's opening game against Zimbabwe. Against the top teams, Mendis has struggled, picking up only three wickets at an average of 33.33 and economy rate of 8.33. Raza Hasan, who has the lowest boundary-run percentage (37.5%), has been a revelation for Pakistan in the tournament so far. In 11 overs, he has given away just 48 runs (economy rate of 4.36) and picked up three wickets. Pakistan's captain Mohammad Hafeez too has been among the wickets (four wickets) and conceded less than a run a ball. Shahid Afridi has decent numbers overall but has a high economy rate (7.68) and average (61.50) against top teams.
| Bowler | Runs conceded | Balls bowled | Wickets | Economy rate | Average | % boundary runs |
| Ajantha Mendis | 108 | 96 | 9 | 6.75 | 12.00 | 57.40 |
| Jeevan Mendis | 54 | 54 | 5 | 6.00 | 10.80 | 40.74 |
| Akila Dananjaya | 58 | 48 | 4 | 7.25 | 14.50 | 37.93 |
| Saeed Ajmal | 130 | 120 | 8 | 6.50 | 16.25 | 52.30 |
| Mohammad Hafeez | 95 | 96 | 4 | 5.93 | 23.75 | 46.31 |
| Raza Hasan | 48 | 66 | 3 | 4.36 | 16.00 | 37.50 |
| Shahid Afridi | 143 | 120 | 3 | 7.15 | 47.66 | 41.95 |
In the first six-over period of the innings (Powerplay overs), Sri Lanka are well ahead of Pakistan on the batting front. With both Tillakaratne Dilshan and Mahela Jayawardene in good form, Sri Lanka have maintained an excellent scoring rate (8.60) without losing too many wickets. Pakistan, on the other hand, have been inconsistent at the start in most matches. In their three matches in the Super Eights, Pakistan scored 110 runs in the 18 overs (run-rate 6.11) losing seven wickets. Sri Lanka, who topped their group, were superb in the Powerplay overs in the Super Eights scoring 167 runs in 18 overs (run-rate 9.27) losing just two wickets. Both teams have fairly similar stats in the first six overs on the bowling front though, with Pakistan boasting a slightly better economy rate (6.43).
Sri Lanka's batting order has generally been top heavy and as a result, the average and scoring rate in the middle of the innings have been low. In the same period (overs 7-14), Pakistan have the better average (33.22) and scoring rate (7.47). In the middle overs, Sri Lanka have been slightly more expensive but have picked up more wickets (10). In the last six-over period, there is very little to choose between the two teams on the bowling front. However, Sri Lanka have a much better batting average (25.87) and scoring rate (10.70) in the final six overs.
| Period of innings | Pakistan (bat avg, bat rr) | Sri Lanka (bat avg, bat rr) | Pakistan (bowl avg, bowl rr) | Sri Lanka (bowl avg, bowl rr) |
| Overs 1-6 | 28.12, 7.50 | 43.00, 8.60 | 27.57, 6.43 | 20.30, 6.76 |
| Overs 7-14 | 33.22, 7.47 | 29.50, 7.15 | 34.87, 6.97 | 23.70, 7.18 |
| Overs 15-20 | 16.26, 8.71 | 25.87, 10.70 | 16.40, 9.11 | 12.73, 8.88 |
Jayawardene notched up his sixth fifty-plus score in the World Twenty20 during Sri Lanka's nine-wicket win against West Indies. Dilshan, one of only five batsmen to score a century in Twenty20 internationals, has also been in fine form in the tournament scoring 144 runs in five innings. In contrast, Pakistan's openers have failed to get going with Imran Nazir in particular falling to rash shots in the Super Eights stage. Nasir Jamshed, who has two fifty-plus scores in the tournament, has boosted Pakistan's numbers in the middle order. Pakistan's middle-order batsmen also have a higher boundary percentage (52.77) as compared to their Sri Lankan counterparts. The Sri Lankan lower middle-order (positions 5-7) batsmen have hardly had much to do so far in the tournament losing only five wickets in the six matches. For Pakistan, Umar Akmal has been the stand-out batsman in the lower middle-order. Akmal, who remained unbeaten in Pakistan's successful chase against South Africa, has scored 96 runs (average 48.00) while being dismissed only twice.
| Batting position | Team | Innings | Runs | Average | SR | 50+ scores | Boun % |
| 1-2 | Sri Lanka | 10 | 316 | 35.11 | 131.66 | 2 | 62.65 |
| 1-2 | Pakistan | 10 | 255 | 25.50 | 122.59 | 1 | 64.31 |
| 3-4 | Sri Lanka | 9 | 192 | 24.00 | 122.29 | 0 | 45.83 |
| 3-4 | Pakistan | 10 | 216 | 27.00 | 131.70 | 2 | 52.77 |
| 5-7 | Sri Lanka | 11 | 141 | 28.20 | 145.36 | 0 | 45.39 |
| 5-7 | Pakistan | 12 | 188 | 20.88 | 111.24 | 0 | 51.06 |
The Premadasa stadium, once a venue that regularly favoured the side batting first, has provided no particular advantage in this tournament. In 12 matches, six have been won by the team chasing and five by the team batting first. The story with the toss is a completely different one though; the team winning the toss has won one and lost ten matches. The overall average and run-rate are higher in the first innings (24.21 and 7.60 respectively) as compared to the corresponding stats in the second innings (20.96 and 7.26). Pace bowlers have dominated the wickets tally in the first innings picking up 49 wickets at 7.78. Spinners, however, have had a much better economy rate (6.84) in the first innings. In the second innings, spinners have outperformed the pace bowlers on the wickets front too picking up 34 wickets at 6.57 while the fast bowlers have managed 26 wickets at a much higher economy rate of 7.80.
| Matches | Wins/losses | Run-rate | Average | Boundary% | Pace (wickets,econ) | Spin(wickets,econ) | |
| 1st innings | 12 | 5/6 | 7.60 | 24.21 | 53.78 | 49, 7.78 | 22, 6.84 |
| 2nd innings | 12 | 6/5 | 7.26 | 20.96 | 59.05 | 26, 7.80 | 34, 6.57 |
Madhusudhan Ramakrishnan is a sub-editor (stats) at ESPNcricinfo