We're winning this... wait, how did we lose it?
Instances in Test cricket when teams were well ahead of the game after two or three innings, but went on to lose
Anantha Narayanan
12-Apr-2025
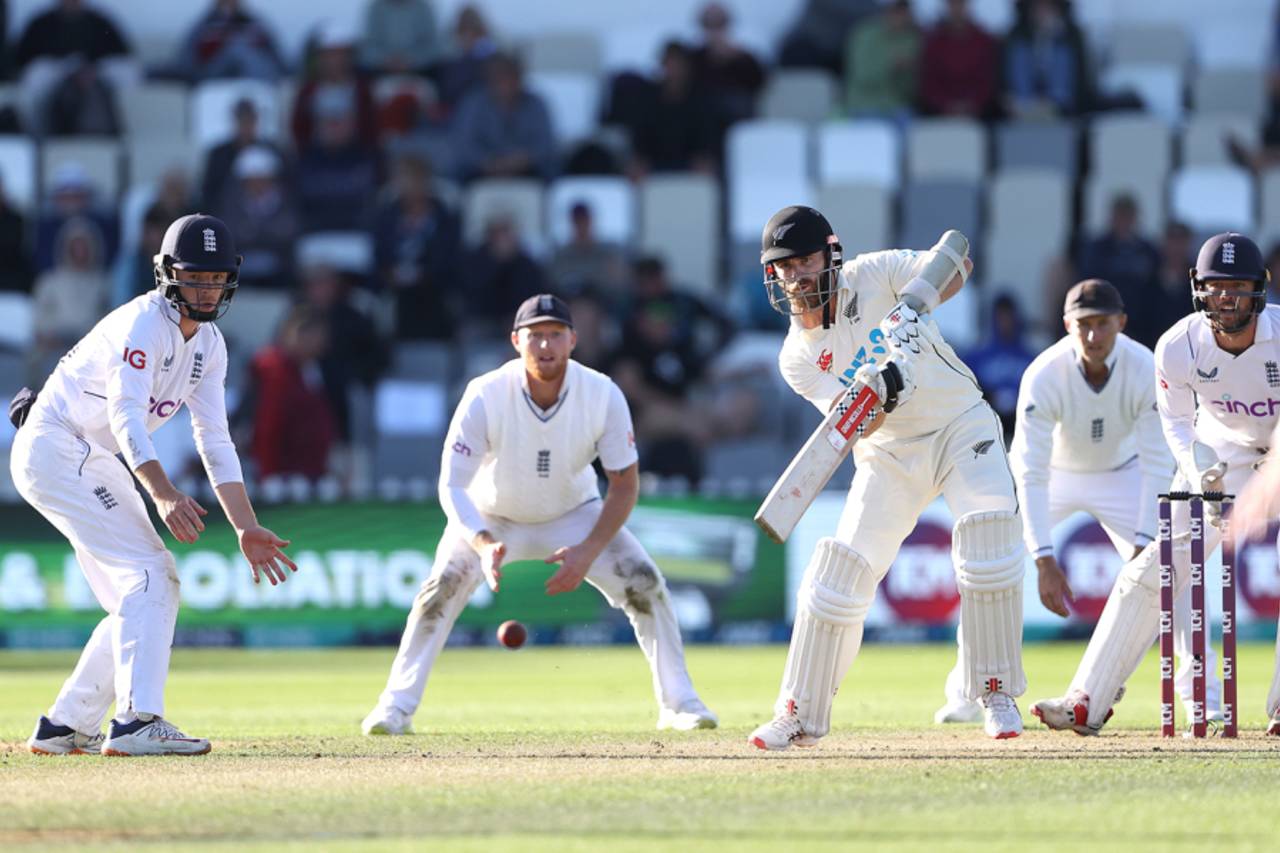
England would have expected a comfortable win in Wellington in 2023 after they got New Zealand to follow on, but the hosts eventually won by one run • Getty Images
Normally we tend to romanticise matches where teams were down in the dumps or on the edge of a cliff and then bounced back and achieved totally unexpected wins. I have covered such matches in different articles myself. Today, I will be looking at the other side - teams that were looking at a comfortable win and then proceeded to lose.
A win after following on or losing after enforcing the follow-on can fit in either category. However, the during-innings situations (the points in the third or fourth innings where the team that ultimately won were at their lowest) are tricky to parse for an analysis such as this one. It is not possible to only select the losing teams from the other list and move on. In these articles, half the fun is in identifying the matches, using somewhat complex algorithms. I have been working on this article on and off for the past few months, tweaking the methodology repeatedly.
My initial thought was to do this work for all four innings of Test matches. However, it is a fact that until two innings are played, the match situation in most matches is unclear. There is an increase in instances of teams scoring, say, 500 or more runs in either of the first two innings, and then losing. We have had 10 such instances since the start of 2000 (excluding Pakistan's forfeiture at The Oval in 2006) - three more than in the previous 123 years.
In fact, only twice in these 17 matches did the winning team even take a lead in the first innings. The highest such losing total is 595 - by Bangladesh in Wellington in 2017. The fact that the score of 500 was reached indicates that it was a very good wicket. Whether it is a question of the second batting team matching the 500-plus score and then dismissing the first team for a chaseable score - as India did in Adelaide in 2003; or of batting like a T20 match (take a big lead and win, as England did in Multan last year) the reality is that no team is totally safe.

On the other hand, if a team is all out for a sub-100 total, be it in the first or second innings, the pitch is likely to be a very tough one and everything is not lost for the low-scoring team. The have been 13 instances of teams finishing with sub-100 totals in their first innings and winning: five such instances have come since the turn of the millennium (excluding the Centurion Test of 2000) compared toeight instances in the previous 123 years. Not once in these matches did the winning team take a lead in the first innings. The lowest winning first-innings score is 45 - by England in Sydney in 1887.
Both sets of matches that contained such unexpected results were featured in the quirky-stats section of my March article.
Since nothing can be really concluded until the completion of the first two innings, I have looked only at third and fourth innings. At the halfway stage, there is a clear indication of which way the wind is blowing. There could be parity, or a lead - substantial or otherwise - for either team. At that point in a match, we also have the Runs-per-Wicket (RpW) values for the first two or three innings, which can be used for analysis of the third and/or fourth innings.
A note on the RpW_12 (for the first two innings) and RpW_123 (for the first three innings) values. The former is a straightforward computation based on the values from the first two innings, since the two teams have played an innings each. The only caveat is that the derived RpW_12 values are limited to 50. The RpW_123 value is calculated in a more complex manner since it is based on an unbalanced situation - one team having played two innings and the other team one.
The formula is 0.2*RpW1 + 0.3*RpW2 + 0.5*RpW3, if there was no follow-on. The formula is changed to 0.3*RpW1 + 0.2*RpW2 + 0.5*RpW3, if there has been a follow-on. The derived RpW_123 values are limited to 50 again, to avoid outlier numbers. The most recent innings gets the greatest weight, since it is a clear indicator of the way in which the pitch is changing.
Using these RpW values I determine how many wickets are required to win in various situations, and use that value as the criterion for selecting matches.
I will be looking at the team situations at different times during the innings. At times a team might look to be winning on multiple occasions during a match but goes on to lose. A perfect example of this is the 1981 Headingley Ashes Test. First, Australia were sitting pretty between the second and third innings with a lead of 227 runs; then when England were tottering at 135 for 7 after following on; then at the start of the fourth innings, with a low target to chase; and finally when they were 56 for 1 chasing 130. Even after all that, Australia lost.
I have a total of eight tables. For each innings I have the batting team and bowling team covered - at the start of the innings and during the innings. The selection processes vary from table to table and are quite complex. I would suggest that the reader takes their time to understand the process. And do not forget that the featured teams are the ones that lose, though the narratives often refer to the winning teams.
The first table, below, covers the team that is batting in the third innings and loses. This covers situations in between the second and third innings - the exact mid-point of the match.
These are fairly straightforward situations. In Durban in 1950, South Africa had a first-innings lead of 236. They did not enforce the follow-on and were dismissed for 99 in the second innings, and Australia won comfortably, through an all-time classic 151 not out by Neil Harvey.
The famous Vernon Philander-led win for South Africa in Cape Town over Australia in 2011 comes in next. Australia lost despite a first-innings lead of 188.
Later in the table comes the famous Bridgetown Test in 1999. Australia's lead of 161 was nullified by the brilliance of Brian Lara, who went on to orchestrate a tough 300-plus chase.
Now for the during-innings situations. At the fall of each wicket, by using the RpW_12 values, I determine the expected target that the batting team will be able to set. I select the wicket fall at which the target set would be the highest. Then, using the RpW_123 values, I determine the number of wickets that will be needed in the fourth innings. This value indicates how difficult the task is likely to be for the team batting last. If that number is 15 or more, it is a very difficult task, and if it is more than 20, virtually impossible. Still, the team batting fourth won. I look here at instances of teams that were sitting on wickets-required values of around 20, indicating how comfortable they were. The expected target is a complex calculation involving the two RpW values and the number of wickets lost.
At Lord's in 2000, West Indies had a 133-run lead and even at 24 for 3, were looking at setting a near-300-run target, which translated to around 23 wickets. Then they collapsed and lost a close match.
In in Kandy in 2006, a similar situation played out. Sri Lanka, with a lead of over 100, were at 56 for 3, looking to set a big target. They collapsed and Pakistan romped home comfortably.
At The Oval in 1902, Australia had a 141-run lead in the first innings and were sitting pretty at 71 for 3. They set England a tough target of 263, but Gilbert Jessop and George Hirst took the hosts home.
The next table features teams that bowled in the third innings with a 200-plus lead and still lost. This is the most straightforward of the tables. Four of these are famous matches: in Sydney in 1894, Australia lost to England despite gaining a first-innings lead of 261.
At Headingley in 1981, Ian Botham and Bob Willis inspired the most famous comeback of all.
In Kolkata in 2001, VVS Laxman, Rahul Dravid and Harbhajan Singh orchestrated a miracle against Australia.
Finally, the recent Wellington wonder, where New Zealand bounced back from a follow-on to beat England by one run.
There are two Tests where the first batting team conceded a lead of over 200 runs and still won. In Colombo in 1992, Sri Lanka took a lead of 291. Even after Australia piled up 471 in their second innings, Sri Lanka needed only 181 to win. But spinners Greg Matthews and Shane Warne shared seven wickets to consign Sri Lanka to an unexpected 16-run defeat.
In Sydney in 2010, Australia conceded a lead of 206 to Pakistan, but Mike Hussey's unbeaten hundred set up a tight chase and then offspinner Nathan Hauritz took five to bowl Pakistan out cheaply.
Now we move on to the during-innings situations. The bowling team has a substantial first-innings lead and has the batting team on the ropes. Based on the RpW values, the bowling team need a few wickets to chase the expected low target, but they still lose. Or else, the lead is not significant but the target is still a comfortable one to chase. All the wicket-fall situations are analysed and the worst one for the batting team is selected.
Here too I have excluded the six 200-plus-lead matches that were featured in the previous table. In each of those matches there were situations in the third innings in which the losing teams were way ahead.
The first match featured is one of the greatest recoveries ever. In Galle in 2015, India took a lead of 192 and Sri Lanka were 5 for 3, staring at an innings defeat. Then Dinesh Chandimal scored 162 not out and Rangana Herath took seven wickets to beat India.
Sixty years before that England conceded a lead of 171 to South Africa at Lord's. In their second innings, however, England's captain, Peter May, scored a hundred and then fast bowler Brian Statham destroyed South Africa with 7 for 39.
The situation was similar in Sydney in 1892. Australia had a deficit of 163, but they recovered in their second innings and then medium-pacer George Giffen routed England with 6 for 72.
The fourth match is a recent David-Goliath encounter. Playing at Lord's in 2019, Ireland dismissed England for 85 and took a first-innings lead of 122. Then England, at 26 for 1, were looking at setting only a 22-run target but recovered to set one of over 180, and Ireland batted poorly and lost.
Now it is time to move on to the fourth-innings situations. To start with, the situations at the innings break time.
In a match already featured here, Sri Lanka's target in Colombo in 1992 was a mere 181, with only 3.7 required, until they encountered the Australian spinners. That tops the table.
At the beginning of the fourth innings at Headingley in 1981, Australia needed to score 130, which translated to 3.8 wickets, based on the RpW_123 value of 34.6. Willis obviously did not see eye to eye with this prediction.
At the SCG in 1894, the story was similar. England, following on 261 runs behind, scored 437, and Australia's target was 177 in a high-scoring match, translating to 3.9 wickets. However, Australia did not reckon with Bobby Peel, who took 6 for 67 to hand England a ten-run win.
In fourth place is a famous Indian win, from Melbourne in 1981. Australia took a first-innings lead of 182 and dismissed India for 324. The target was only 143, but Kapil Dev ran through the middle and lower order, bowling Australia out for 83.
In the table below, we look at situations during the fourth innings. The losing teams were comfortably placed in the chase but still lost. I look at the wickets still required to win and feature the situations in which fewer than three wickets were needed.
In Adelaide in 2014, India were set a middling target of 364 by the enterprising Michael Clarke. They were coasting comfortably at 242 for 2, with a patient M Vijay and a rampant Virat Kohli at the crease. They lost Vijay for 99 and then the bottom fell out - thanks to a magnificent Nathan Lyon seven-for. Kohli's 141 went in vain and India lost by 48 runs.
At the MCG in 1998, Australia's target was only 175. They were 103 for 2 and looked comfortable winners when Dean Headley ran through the middle order with a magnificent spell of 6 for 60. Australia lost their last seven wickets for 32 runs and lost the match by 12 runs.
In Bridgetown in 1992, in the first ever Test between South Africa and West Indies, the visitors were set 201 to win and were comfortably placed at 123 for 2. Then Courtney Walsh and Curtly Ambrose became unplayable and South Africa lost eight wickets for 25 runs.
Coming to fourth-innings bowling, first we look at situations between the third and fourth innings. Here I have included the four unsuccessful defences of 400-plus run targets, irrespective of the RpW values, since these are very difficult chases.
In Durban in 1950, South Africa, after refusing to enforce the follow-on with a lead of 236, collapsed for 99. This still left a mountain to climb for Australia. Based on the RpW_123, they needed 25 wickets to win the match. Well, they won by five wickets, with an all-time great innings by Harvey.
Sixty-one years later, in Cape Town, a similar scoreline in the first three innings left South Africa with a target of 236 - over 21 wickets needed based on the RpW_123 of 10.9. They won comfortably by eight wickets thanks to hundreds from Hashim Amla and Graeme Smith.
The next match featured is a famous recent one, from Headingley in 2019. Scores of 179, 67 and 246 meant that England had a massive task in the fourth innings. This they accomplished, scoring 359, thanks to a thrilling 135 by Ben Stokes. They would have needed 20 wickets to score these runs, based on the numbers from the first three innings.
Finally, situations during the fourth innings. This is quite a tricky proposition. I have to look at this from different wicket-fall positions. The subtitle of the table clarifies.
The table is headed by the famous chase led by Kusal Perera in Durban and the magnificent Leeds revival led by Stokes, within a few months of each other in 2019. Then the Inzamam-ul-Haq and Mushtaq Ahmed last-wicket stand that won Pakistan the 1994 Karachi Test against Australia.
In Multan in 2003, Bangladesh left Pakistan with a tough target of 261 in a low-scoring match. Inzamam played a memorable innings of 138 not out, taking Pakistan from 164 for 7 to a one-wicket win. All these innings are in the top 20 of my list of 100 greatest Test batting performances of all time.
At the Brabourne Stadium in 1964, India took a small lead and dismissed Australia for 274, leaving themselves a reasonable target of 254. However, soon they slumped to 122 for 6 before Mansur Ali Khan Pataudi, Vijay Manjrekar, and Chandu Borde took India to an unforgettable two-wicket win.
In Antigua in 2003, West Indies and Australia were tied at 240 runs apiece. Australia scored 417 and set West Indies what seemed an impossible 418-run target. Despite Lara's 60, the home side slid to 288 for 6, but they won the match through lower-order efforts.
In Johannesburg in 1910, England needed 221 to win but defeat looked imminent at 93 for 6 before Jack Hobbs, batting at No. 5, played a masterful innings of 93 not out and guided them to a three-wicket win.
I hope the readers had as much fun reading this article as I had in writing it. The analytical segments presented a tough challenge indeed. And the variety of selection options made it a great ride.
The quirky stats section
This time I present a collection of ODI innings where the batter scored at a strike rate exceeding 300 for ten or more balls.
This time I present a collection of ODI innings where the batter scored at a strike rate exceeding 300 for ten or more balls.
It is amazing that this list contains a score of 149 - by who but the incomparable AB de Villiers. Nine fours and 16 sixes meant that well over half the 44 deliveries he faced were dispatched to the ropes. This after coming into bat at 247 for 1. What might he have done if he had opened the innings? The mind boggles.
Talking Cricket Group
Any reader who wishes to join my general-purpose cricket-ideas-exchange group of this name can email me a request for inclusion, providing their name, place of residence, and what they do.
Any reader who wishes to join my general-purpose cricket-ideas-exchange group of this name can email me a request for inclusion, providing their name, place of residence, and what they do.
Email me your comments and I will respond. This email id is to be used only for sending in comments. Please note that readers whose emails are derogatory to the author or any player will be permanently blocked from sending in any feedback in future.
Anantha Narayanan has written for ESPNcricinfo and CastrolCricket and worked with a number of companies on their cricket performance ratings-related systems