Measuring batting averages effectively
A stats analysis to determine effective batting averages in the 2000s by measuring bowling quality faced
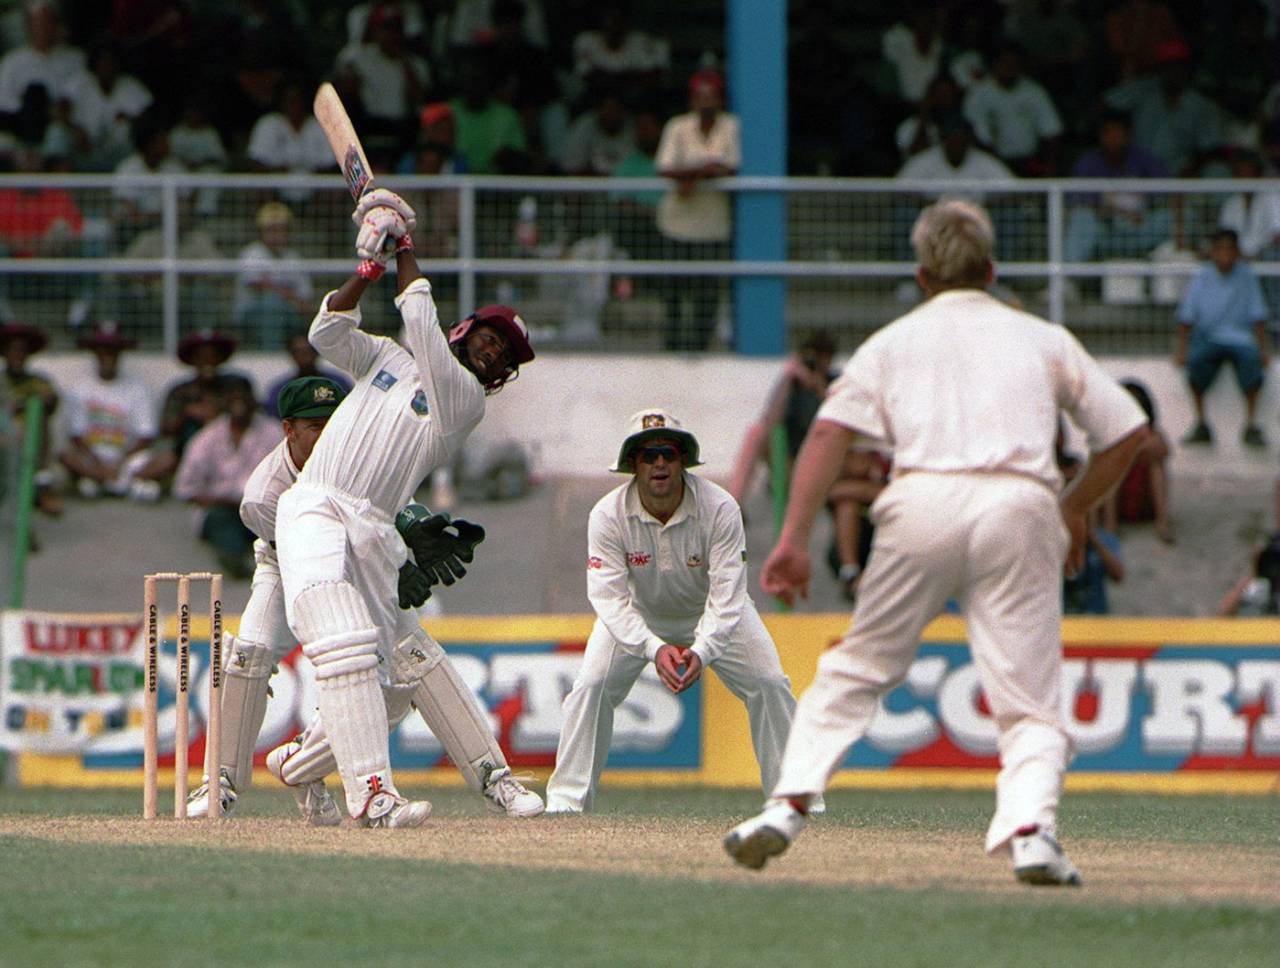
Brian Lara: the highest effective average in the 2000s • Getty Images
The parameters used for the analysis are quite basic. 1. The bowling average for each opponent (in matches involving the player) is taken into consideration for home and away games. 2. The match average for all the matches is used to measure the difficulty level encountered. In matches involving Zimbabwe and Bangladesh, I do not consider the batting average of the minnows as the figure can skew the numbers badly. In these cases, the measure is purely the batting average of the other team.
The base value to measure the quality of an innings is calculated as the geometric mean (square root of the product) of the batting average (30.61) and bowling average (32.31) since Jan 1 1940. The quality index value obtained is 31.44. For each batsman, the similar values are calculated and measured with respect to the base value to obtain the accurate or effective average. For example if the batting and bowling average are 30 and 32 respectively , then the geometric mean is 30.98 and the quality factor is obtained by dividing the base value by the mean which yields 1.0147.
Ricky Ponting has had a wonderful decade as can be seen from his position at the top of the tree. After his horror run in India in 2000-01, he was unstoppable for the next six years, but has shown signs of decline over the last two years. Jacques Kallis and Rahul Dravid have been the rocks of the middle order for their respective teams. Dravid though has been slightly on the wane over the last three years which has seen his average drop from almost 59 to around 54. Mahela Jayawardene and Kumar Sangakkara have contributed immensely to Sri Lanka's rise as a competitive Test team, especially at home. Sachin Tendulkar's recent resurgence has stunned everybody and the early years of the 2000s when his injuries led to some poor performances have now been forgotten completely.
VVS Laxman and Virender Sehwag have eased much of the burden on Tendulkar in this decade with some exceptional performances. Shivanrine Chanderpaul and Brian Lara were the best batsmen for the West Indies in an otherwise forgettable decade. Lara retired on a high scoring 21 centuries in the 2000s. Mohammad Yousuf had a brilliant first half of the decade including a record breaking 2006 when he went past Viv Richards' aggregate runs in a calendar year.
| Batsman | Aus(h) | Aus(a/n) | Eng(h) | Eng(a/n) | Ind(h) | Ind(a/n) | NZ(h) | NZ(a/n) | Pak(h) | Pak(a/n) |
| Ricky Ponting | - | - | 993(16) | 1082(25) | 1115(16) | 530(18) | 496(11) | 362(8) | 781(12) | 440(8) |
| Jacques Kallis* | 700(17) | 708(17) | 1118(19) | 292(13) | 327(8) | 760(15) | 826(13) | 354(6) | 408(5) | 521(8) |
| Rahul Dravid* | 737(24) | 972(24) | 574(14) | 915(15) | - | - | 313(4) | 766(14) | 524(11) | 550(9) |
| Mahela Jayawardene | 185(6) | 274(4) | 1070(14) | 502(12) | 863(14) | 628(10) | 434(7) | 194(7) | 430(15) | 630(15) |
| Sachin Tendulkar | 1173(22) | 925(17) | 546(13) | 629(12) | - | - | 71(4) | 444(9) | 394(8) | 268(7) |
| Matthew Hayden | - | - | 909(17) | 552(18) | 861(13) | 1027(22) | 461(11) | 197(7) | 128(6) | 246(4) |
| Kumar Sangakkara | 112(6) | 391(6) | 671(14) | 336(12) | 892(14) | 365(10) | 317(7) | 334(7) | 619(10) | 695(9) |
| Graeme Smith* | 260(11) | 493(14) | 696(17) | 1083(17) | 227(6) | 431(12) | 220(8) | 290(6) | 347(9) | 358(8) |
| Virender Sehwag* | 763(20) | 833(14) | 290(12) | 237(6) | - | - | 177(4) | 180(9) | 544(6) | 732(8) |
| VVS Laxman | 1082(22) | 1034(17) | 180(9) | 404(11) | - | - | 279(4) | 322(9) | 375(10) | 262(9) |
| Shivnarine Chanderpaul | 699(12) | 260(12) | 400(12) | 1061(20) | 863(15) | 260(5) | 103(3) | 276(8) | 464(9) | 306(9) |
| Mohammad Yousuf | - | 367(12) | 684(9) | 815(15) | 741(10) | 366(11) | 29(1) | 718(14) | - | - |
| Brian Lara* | 533(4) | 707(18) | 500(7) | 503(17) | 413(15) | - | 149(3) | 90(5) | 331(4) | 448(5) |
| Chris Gayle | 186(6) | 449(10) | 474(13) | 721(21) | 481(16) | 160(5) | 280(3) | 540(8) | 115(5) | 324(9) |
| Batsman | SA(h) | SA(a/n) | SL(h) | SL(a/n) | WI(h) | WI(a/n) | Bang(h) | Bang(a/n) | Zim(h) | Zim(a/n) |
| Ricky Ponting | 915(17) | 867(17) | 207(5) | 198(6) | 707(19) | 846(11) | 69(2) | 191(3) | 259(3) | - |
| Jacques Kallis | - | - | 257(7) | 318(10 | 929(11) | 942(22) | 254(4) | 63(3) | 112(2) | 388(3) |
| Rahul Dravid | 453(12) | 504(16) | 542(7) | 662(21) | 148(5) | 1260(22) | - | 560(10) | 504(6) | 475(7) |
| Mahela Jayawardene | 1158(12) | 314(10) | - | - | 335(8) | 294(7) | 556(7) | 304(7) | 167(4) | 137(2) |
| Sachin Tendulkar | 414(11) | 392(10) | 386(9) | 485(11) | 306(5) | 331(8) | - | 820(9) | 616(6) | 199(4) |
| Matthew Hayden | 862(18) | 540(11) | 381(7) | 283(6) | 681(14) | 379(8) | 61(2) | 107(3) | 501(3) | - |
| Kumar Sangakkara | 790(12) | 392(10) | - | - | 452(8) | 238(7) | 592(7) | 284(7) | 255(4) | 281(2) |
| Graeme Smith | - | - | 88(3) | 179(4) | 717(12) | 876(13) | 408(4) | 335(5) | 162(2) | - |
| Virender Sehwag | 924(11) | 238(9) | 547(7) | 692(11) | 286(5) | 357(7) | - | 176(6) | 74(1) | 102(3) |
| VVS Laxman | 333(9) | 330(9) | 370(9) | 494(11) | 271(4) | 731(15) | - | 117(4) | 31(2) | 249(6) |
| Shivnarine Chanderpaul | 820(15) | 533(11) | 130(4) | 154(4) | - | - | 108(2) | 39(3) | 73(3) | 186(6) |
| Mohamamad Yousuf | 96(3) | 255(8) | 285(12) | 338(11) | 665(5) | 549(9) | 227(4) | 276(2) | - | 222(3) |
| Brian Lara | 793(15) | 531(8) | 299(3) | 688(6) | - | - | 173(2) | - | - | 222(4) |
| Chris Gayle | 814(20) | 545(10) | 164(7) | 54(6) | - | - | 221(3) | 126(3) | 46(3) | 307(7) |
The fact that Ponting played in a top class team meant that victories were assured more often than not and also meant he faced weaker attacks for much of the 2000s. He struggled in the subcontinent, but was very successful at home and in South Africa. The Pakistani attacks were far less potent away in the 2000s after the retirement of Wasim Akram and Waqar Younis. All this pointed to Ponting facing comparatively weaker attacks in fairly easy conditions which is quite clearly a blot on an otherwise superb decade. Kallis has faced fairly consistent attacks throughout. His run glut against the minnows does pull his average down. Rahul Dravid's best performances usually came when the chips were down and he has been very prolific in almost all away conditions. A considerable proportion of his runs though, have been made against the weakened West Indies and the minnows. Jayawardene and Sangakkara have scored tons of tuns against Bangladesh home and away boosting their averages. They have hardly played and succeeded in Australia and South Africa though Sangakkara's 192 at Hobart was one of the best innings of the decade. Sri Lanka's awesome home record and ordinary away record is very evident from the less impressive showing of these two batsmen in away matches. Matthew Hayden resurrected his career on the 2000-01 tour of India and proceeded to amass 30 centuries at a rate only next to Bradman. He, like Ponting, played in a top team and faced ordinary attacks throughout. His away performance was definitely under par when compared to his home batting.
Tendulkar's prolific recent run has seen him score at a Bradmanesque average and he recently registered his sixth double century. His records in the 2000s against Australia has been excellent but the lack of quality in the attack in recent years does pull down his performance a little. He has also aggregated plenty against the minnows home and away in the past decade. Sehwag and Laxman also average more than 50 in the 2000s. Sehwag has two triple hundreds and four double tons. The Chennai and Lahore efforts though came on very flat tracks and the innings against Sri Lanka in Mumbai was against a highly weakened attack. Laxman usually has reserved his best against the top teams and hardly ever makes massive scores against the lesser opponents which have ensured that his contributions are always valued highly.
Brian Lara played in a team accustomed to losing in the 2000s. Right from the remarkable 2001 tour of Sri Lanka where he scored 688 runs in 3 Tests only to lose 3-0, he has made runs home and away against all opponents. His average against Australia is 47 in matches involving McGrath. His otherwise ordinary showing against England is boosted by the unbeaten 400 in Antigua. His consistency was exceptional in the last 3-4 years as he scored hundreds against Pakistan and South Africa home and away. Chanderpaul's case is similar as he has been part of a very weak outfit for much of this decade and has done brilliantly in losing causes.
| Batsman | Aus(h) | Aus(a/n) | Eng(h) | Eng(a/n) | Ind(h) | Ind(a/n) | NZ(h) | NZ(a/n) | Pak(h) | Pak(a/n) |
| Ricky Ponting | - | - | 0.7602 | 0.8975 | 0.7362 | 0.9803 | 0.7495 | 0.6821 | 0.8298 | 1.2303 |
| Jacques Kallis | 1.0493 | 0.9353 | 0.9367 | 0.9295 | 0.9824 | 0.8805 | 0.9599 | 0.7748 | 0.9757 | 0.8589 |
| Rahul Dravid* | 0.9357 | 0.8458 | 0.9295 | 0.8048 | - | - | 0.5993 | 0.9980 | 0.7167 | 0.6545 |
| Mahela Jayawardene | 1.0799 | 1.0310 | 0.9034 | 0.9935 | 0.7756 | 0.8823 | 0.7634 | 1.1236 | 1.0553 | 0.8867 |
| Sachin Tendulkar | 0.9183 | 0.8893 | 0.8808 | 0.8072 | - | - | 0.7478 | 0.8450 | 0.8148 | 0.6840 |
| Matthew Hayden | - | - | 0.7555 | 0.9176 | 0.7055 | 0.9833 | 0.7476 | 0.7841 | 0.7949 | 1.1382 |
| Kumar Sangakkara | 1.0799 | 1.0465 | 0.9034 | 0.99135 | 0.7756 | 0.8823 | 0.7645 | 1.1236 | 1.0657 | 0.7290 |
| Graeme Smith* | 1.0679 | 0.9171 | 0.9308 | 0.8195 | 1.1856 | 0.8141 | 0.9921 | 0.7748 | 0.9756 | 0.8589 |
| Virender Sehwag* | 0.9356 | 0.8076 | 0.9390 | 0.7216 | - | - | 0.5994 | 0.9980 | 0.7741 | 0.6545 |
| VVS Laxman | 0.9584 | 0.8530 | 0.8513 | 0.7994 | - | - | 0.5994 | 0.9980 | 0.7899 | 0.6545 |
| Shivnarine Chanderpaul | 0.9517 | 1.1543 | 0.9722 | 1.0476 | 0.9237 | 1.0987 | 0.9347 | 1.0011 | 1.0465 | 1.0459 |
| Mohammad Yousuf | - | 1.1473 | 0.8558 | 0.9556 | 0.6944 | 0.7859 | 0.7107 | 0.9887 | - | - |
| Brian Lara* | 1.0891 | 1.2303 | 1.0850 | 1.2345 | 0.9250 | 1.0804 | 1.1582 | 1.0622 | 0.9080 | |
| Chris Gayle | 0.8670 | 0.9263 | 0.8804 | 1.0749 | 0.9250 | 1.1637 | 1.0804 | 1.0527 | 1.1037 | 0.9351 |
| Batsman | SA(h) | SA(a/n) | SL(h) | SL(a/n) | WI(h) | WI(a/n) | Bang(h) | Bang(a/n) | Zim(h) | Zim(a/n) |
| Ricky Ponting | 0.8006 | 0.9059 | 0.5873 | 0.9594 | 0.8462 | 0.7027 | 0.3539 | 0.5627 | 0.4184 | - |
| Jacques Kallis | - | - | 0.9848 | 1.1188 | 0.6881 | 0.8749 | 0.4910 | 0.5941 | 0.3962 | 0.3210 |
| Rahul Dravid | 1.0164 | 1.1325 | 0.6701 | 0.9353 | 0.8365 | 0.9240 | - | 0.6127 | 0.4725 | 0.8009 |
| Mahela Jayawardene | 0.8508 | 1.4016 | - | - | 0.8985 | 0.9608 | 0.4264 | 0.7099 | 0.5016 | 0.3336 |
| Sachin Tendulkar | 0.9096 | 1.1583 | 0.7320 | 0.7995 | 0.9168 | 0.9678 | - | 0.6139 | 0.4663 | 1.1030 |
| Matthew Hayden | 0.8052 | 0.8969 | 0.7573 | 0.9623 | 0.8646 | 0.6560 | 0.3533 | 0.5627 | 0.4184 | - |
| Kumar Sangakkara | 0.8508 | 1.4016 | - | - | 0.8985 | 0.9608 | 0.4273 | 0.7099 | 0.5016 | 0.3336 |
| Graeme Smith | - | - | 1.0559 | 1.0277 | 0.6880 | 0.6903 | 0.4772 | 0.6267 | 0.3970 | |
| Virender Sehwag | 0.8245 | 1.1322 | 0.6957 | 0.8791 | 0.8366 | 0.8608 | - | 0.6407 | 0.9945 | 0.6754 |
| VVS Laxman | 0.9350 | 1.0955 | 0.7290 | 0.8358 | 0.8366 | 0.9271 | - | 0.6930 | 0.3630 | 0.8692 |
| Shivnarine Chanderpaul | 0.9740 | 1.0715 | 0.9560 | 1.6700 | - | - | 0.4079 | 0.7548 | 1.3315 | 0.8383 |
| Mohammad Yousuf | 0.8219 | 1.2829 | 1.0985 | 1.0370 | 0.7561 | 1.0519 | 0.5406 | 0.5872 | - | 0.8901 |
| Brian Lara | 1.0368 | 0.8171 | 0.8839 | 1.0385 | - | - | 0.4079 | - | - | 1.1129 |
| Chris Gayle | 1.0411 | 0.9132 | 0.9259 | 1.0385 | - | - | 0.4079 | 0.7548 | 1.3315 | 0.8383 |
** The quality value for Ponting and Hayden in the ICC World XI match is 1.2964.
The table below lists the effective averages of the top batsmen in the 2000s. Brian Lara is on top in terms of quality of innings played and Ricky Ponting and Matthew Hayden are at the bottom. This is not a method that questions the quality of a player, but merely an alternative to measure the average effectively.
| Batsman | Actual runs | Actual average | Effective runs | Effective average | Quality deviation |
| Brian Lara | 6380 | 54.06 | 6572.1 | 55.69 | 1.0301 |
| Shivnarine Chanderpaul | 6735 | 53.03 | 6805.0 | 53.58 | 1.0103 |
| Rahul Dravid | 8904 | 53.63 | 8733.0 | 52.6 | 0.9807 |
| Mohammad Yousuf | 6633 | 56.21 | 5950.5 | 51.29 | 0.9124 |
| Jacques Kallis | 9277 | 59.08 | 8022.3 | 51.09 | 0.8647 |
| Kumar Sangakkara | 8016 | 56.85 | 6800.9 | 48.23 | 0.9112 |
| Mahela Jayawardene | 8475 | 55.39 | 7324.3 | 47.87 | 0.8642 |
| Sachin Tendulkar | 8399 | 57.13 | 6933.4 | 47.16 | 0.8295 |
| Ricky Ponting | 10158 | 57.38 | 8207.3 | 46.36 | 0.8079 |
| VVS Laxman | 6864 | 52.00 | 5920.4 | 44.85 | 0.8625 |
| Virender Sehwag | 7152 | 53.37 | 5838.1 | 43.56 | 0.8161 |
| Matthew Hayden | 8364 | 52.93 | 6803.6 | 43.06 | 0.7537 |
| Graeme Smith | 7170 | 50.49 | 5818.2 | 40.97 | 0.8114 |
| Chris Gayle | 6007 | 40.31 | 5758.6 | 38.64 | 0.9585 |
A similar approach yields an average of 85.23 for Bradman (three weak teams played considered minnows) and 51.45 for Gavaskar. The approach can be further modified to calculate period wise averages to understand the batting quality better. Gavaskar for example averages almost 83 with 10 centuries against the West Indies prior to 1980 when the bowling attack was not at its best, but only 41 after 1980 with just three hundreds in dull draws, in between falling seven times to Malcolm Marshall before crossing 20.
Madhusudhan Ramakrishnan is a sub-editor (stats) at ESPNcricinfo