Adaptable, inspirational, inconsistent
Brendon McCullum made 1000-plus Test runs from three batting positions, but 21% of his Test aggregate came from just six innings
S Rajesh
19-Feb-2016
Brendon McCullum's Test career has been a memorable one, even if the numbers don't do it complete justice • ESPNcricinfo Ltd
The stats for McCullum were updated after his last Test, which ended on February 24.
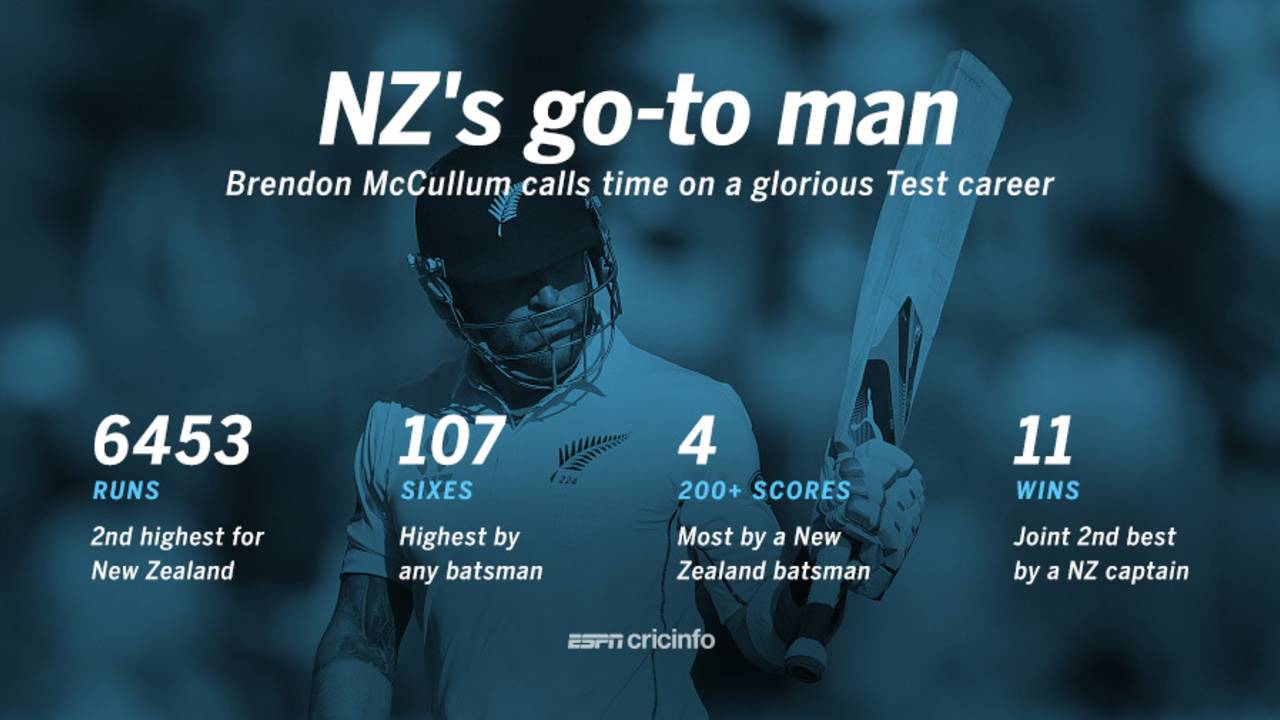
No other player has played 100 successive Tests from debut; only one New Zealand batsman has made more Test runs than him; none has as many 200-plus scores; no batsman has hit as many sixes in Tests, or scored a century in fewer balls; plus, he has been an inspirational captain for their team and a wicketkeeper. Brendon McCullum may not have a huge career average, but his resume in Test cricket is impressive nonetheless.
What also lends heft and more value to his career is the sheer number of roles he has performed for the team. When New Zealand didn't have a strong Test opener, McCullum moved up from his No. 5/6/7 slot, and made a success of it too, scoring more than 1300 runs as opener at an average of almost 40. He is one of only two New Zealand openers - Glenn Turner is the other - to score two double-centuries as a Test opener.
McCullum also made 1000-plus Test runs from two other positions - Nos. 5 and 7. That makes him one of only four batsmen to make 1000-plus Test runs as an opener, and also from at least two other slots. The others who achieved this were Colin Cowdrey, Alec Stewart and AB de Villiers. Both Cowdrey and Stewart scored 1000-plus from three positions other than opening.
Overall, McCullum batted at each of the top nine positions in both Tests and ODIs, the only player to do so in international cricket.
| Position | Inngs | Runs | Average | SR | 100s/ 50s |
| Opening | 35 | 1316 | 39.87 | 60.70 | 2/ 6 |
| No. 5 | 44 | 1887 | 43.88 | 74.85 | 4/ 5 |
| No. 7 | 48 | 1751 | 38.91 | 63.55 | 5/ 7 |
Over a career spanning 12 years, though, McCullum struggled to achieve the sort of consistency in his batting numbers that would have taken his stats to another level. His career average of 38.64 is the result of some average years interspersed with a few strong ones. In the period between 2008 and 2010 his average rose to almost 43, thanks to a double-century in India, but thereafter he only had one really strong year in Tests - 2014, when he renewed his love affair with India's bowlers and milked them for a double and triple-hundred within a fortnight. He also got 190-plus scores against Sri Lanka and Pakistan in that year, but otherwise, he remained a batsman who could thrill for brief periods, but seldom converted those starts into really substantial scores.
| Period | Tests | Runs | Average | SR | 100s/ 50s |
| Till Dec 2007 | 27 | 1226 | 30.65 | 61.73 | 2/ 6 |
| Jan 2008 to Dec 2010 | 28 | 2006 | 42.68 | 62.22 | 4/ 11 |
| Jan 2011 to Dec 2013 | 27 | 1452 | 31.56 | 58.10 | 1/ 11 |
| Jan 2014 onwards | 19 | 1769 | 52.02 | 77.58 | 5/ 3 |
| Career | 101 | 6453 | 38.64 | 64.60 | 12/ 31 |
Given all those big hundreds he made against India, it's hardly surprising that they are the team against whom he made the most runs (1224) and averaged the highest (68). In fact McCullum is the only New Zealand batsman to score 1000-plus Test runs against India - the next-highest aggregate is 964, by Graham Dowling. McCullum scored 1000-plus Test runs against only one other team - 1041 against England - but needed 30 innings to get those, compared to 1224 in 19 against India.
The opposition teams he didn't favour much at all - till his last Test, at least - were Australia and South Africa: in 54 innings against them he scored only two centuries - though one of them was a jaw-dropping effort - and averaged 27.62. He only scored 185 more runs against them in 54 innings than he did in 19 against India.
Similarly, his stats in specific countries are also skewed. He has enjoyed playing at home, and also in India, the UAE, Bangladesh and Zimbabwe, but not so much elsewhere. All of his 12 Test hundreds have come in those countries, where he averages almost 49 from 66 Tests, but in other countries his average drops to less than half that number. In 35 Tests in Australia, South Africa, England, Sri Lanka and West Indies, he averages only 23.74, with a highest of 97 from 68 innings. In 15 series in these countries, he has averaged more than 35 only twice, and never more than 42. Ten of those 15 series consisted of only two Tests, though, which means batsmen get little opportunity to recover from a poor start to a series.
| Opposition | Inngs | Runs | Average | SR | 100s/ 50s |
| Aus, SA | 54 | 1409 | 27.62 | 57.27 | 2/ 8 |
| B'desh, Zim, Ind, Pak | 50 | 2720 | 57.87 | 64.43 | 8/ 8 |
| Eng, SL, WI | 72 | 2324 | 33.68 | 70.25 | 2/ 15 |
| Host country | Inngs | Runs | Average | SR | 100s/ 50s |
| Aus, SA, Eng, SL, WI | 68 | 1591 | 23.74 | 57.74 | 0/ 10 |
| NZ, Ind, UAE, B'desh, Zim | 108 | 4862 | 48.62 | 65.82 | 12/ 21 |
McCullum's inconsistency comes through in another stat: among the 31 batsmen who have made three or more 200-plus scores, his career average is the poorest. The next lowest is Marvan Atapattu's 39.02, while none of the others have averages lower than 40.
A break-up of McCullum's scores also reveals a career of very high peaks but fairly low troughs as well. His six highest Test scores - 302, 225, 224, 202, 195, and 185 - accounts for 20.66% of the total Test runs he has scored. It's unusual for 21% of the total runs in long career coming from just 3.5% of a batsman's innings: for most top batsmen it is in the 13-16% range.
McCullum's high percentage contribution from a few innings also indicates he hasn't scored enough from his other innings, which suggests an approach far too risky to deliver a high rate of success. His aggression and his audacity in strokeplay was breathtaking at times and led to some amazing innings, but equally, his approach was so fraught with risk that the percentages weren't in his favour. Fifty times he was dismissed before reaching 10, and 75 times before 20. Consistency wasn't his forte, but that unpredictability was also what made him so exciting to watch.
| Batsman | 200+ scores | Runs | Inns | Dis | Ave |
| Brendon McCullum | 4 | 6453 | 176 | 167 | 38.64 |
| Marvan Atapattu | 6 | 5502 | 156 | 141 | 39.02 |
| Stephen Fleming | 3 | 7172 | 189 | 179 | 40.07 |
| Sanath Jayasuriya | 3 | 6973 | 188 | 174 | 40.07 |
| Chris Gayle | 3 | 7214 | 182 | 171 | 42.19 |
| Score range | No. of inngs |
| 0 to 9* | 50 |
| 10 to 19* | 25 |
| 20 to 49 | 51 |
| 50 to 99 | 31 |
| 100 to 180 | 5 |
| 180 and above | 6 |
And then there is McCullum the captain. He finished with a 11-11 win-loss record, though the losses column mounted towards the end with four defeats in five Tests against Australia; only Fleming, among all New Zealand captains, has won more Tests. In the two years from January 2014 to December 2015, New Zealand won nine out of 17 Tests, all of them with McCullum as captain. It's their highest win percentage over two successive calendar years, and the first time they've won more than 50% of Tests played during this period.
The back-to-back Test series against Australia didn't go to plan in terms of results, but McCullum still signed off in style, scoring the fastest Test hundred. And his last scoring shot typified McCullum the batsman: a pull for six, the 107th of his Test career. There could be no better illustration of going out on your own terms.
| Years | Won | Lost | Drawn | Mats | Win % |
| 2014-2015 | 9 | 5 | 3 | 17 | 0.53 |
| 1982-1983 | 4 | 4 | 1 | 9 | 0.44 |
| 2001-2002 | 7 | 3 | 6 | 16 | 0.44 |
| 1998-1999 | 8 | 5 | 6 | 19 | 0.42 |
S Rajesh is stats editor of ESPNcricinfo. Follow him on Twitter