DLS or VJD?
The D/L method has undergone another modification and has a new name as well, but there remain areas where its results are iffy
S Rajesh
15-May-2015
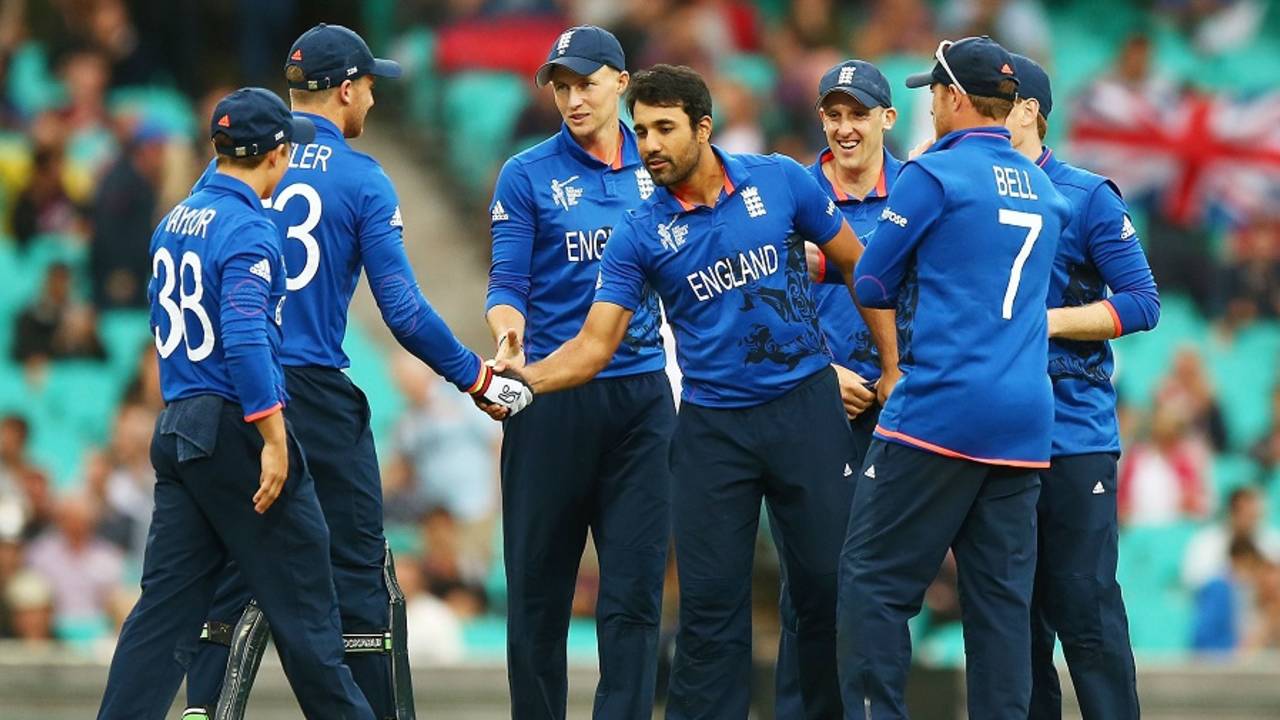
According the new DLS method, there's only a ten-run difference in the 20-over target score between totals of 140 for 4 and 190 for 4 • ICC
In the 2015 World Cup, the Duckworth-Lewis-Stern method, a modification of the D/L system, came into play four times in 49 games. Among the games in which it was used was a low-scoring one between Pakistan and South Africa, in which Pakistan's score of 222 all out in 46.4 overs changed into a target of 232 for South Africa in 47. Three overs were lopped off due to rain during Pakistan's innings, and even though Pakistan were bowled out within 47, they still benefited by nine runs, as the loss of three overs might have affected the way they would have paced their innings. The earlier D/L method pegged the target at 231, while the V Jayadevan method (VJD), which has generally received favourable reviews for its target-setting as well, pegged it at 226.
In this case, the DLS and VJD targets were both pretty reasonable and similar to each other, but there are other instances when they aren't so close. (By the way, in the cliffhanger semi-final, the DLS target was 298, while the VJD one was 300; New Zealand ended up scoring 299 and winning with a ball to spare.) The DLS system has undergone several modifications, and while there have been improvements - especially since the computerised system replaced the manual one - there continues to be areas of concern, especially in the sluggish manner of setting targets in higher scoring games, especially in the 50-over format. The latest modification - championed by Steve Stern, who is the 'S' in DLS - was meant to improve this specific area of the system, but closer scrutiny of the system shows problem areas continue to exist, especially with internal consistency.
The example below illustrates inconsistencies within the DLS system, when comparing results that it throws up for different match situations:
When a team is bowled out for 150, the 20-over target for the team chasing is, according to DLS, 93; the VJD system calculates it to be 91. For a score of 200, the 20-over targets by the two methods are 124 and 118; for a total of 250, the targets are 154 and 142. Till here, the increase in the DLS targets for every 50-run increase in the total is around 30 runs; the VJD method increases it by 27 and 24 runs. However, for a total of 300, the DLS target is 163, which is nine more than the 250 target, and for a 350 total, the DLS target increases to only 174. That means the difference in 20-over targets between a 50-over score of 250 and 350 is only 20 runs - a team scoring 350 will have reason to feel shortchanged, given that the 20-over target is only 20 more than it would have been if the team had scored 250. The 100-run difference in scores converts to an average of two per over, yet the target goes up by one run per over.
The previous version of this system - the D/L method - actually did better in these cases: the 250-run target then was 151, and the target for a 350 total was 181, a difference of 30 runs. In the VJD method, the targets move up quite evenly, and the 350 total generates a target which is 40 more than the 250 target.
| Team 1 score | DLS target | DLS tgt diff | VJD target | VJD tgt diff |
| 150 | 93 | _ | 91 | _ |
| 200 | 124 | 31 | 118 | 27 |
| 250 | 154 | 30 | 142 | 24 |
| 300 | 163 | 9 | 163 | 21 |
| 350 | 174 | 11 | 182 | 19 |
In the table below too, the DLS targets show sluggish movement for higher totals. This could be particularly disadvantageous to the team batting first, especially in today's age of 20-over cricket where teams are used to chasing almost anything in around 20 overs.
In the next list, the target in 20 overs, for a 30-over score of 90 for 4 by the team batting first, is 103. For a score of 140 for 4, the target moves up by 52 runs to 155. However, when the score increases by 50 further runs to 190 for 4, the target this time goes up by just 10, to 165. Clearly, the movement in targets is much sharper for lower totals, and not enough for higher scores.
The previous version of D/L was again a bit more more nimble at higher totals: the targets were 100 if the team batting first made 90 for 4, 151 at 140 for 4, and 171 at 190 for 4; the difference between the targets for scores of 140 and 190 was 20, compared to 10 with the DLS method. In the VJD system, the difference in targets is 31, and overall the targets appear to be more realistic and in tune with the scores of the team batting first.
Similarly, if an interruption occurs after 20 overs when the team batting first has scored 104 without loss, the DLS 20-over target for the team chasing is 170; had the team batting first scored half those many runs - 52 without loss - the target would have still been 154, only 16 runs fewer. In the earlier D/L method, the difference would have been 36 (181 versus 145), and in the VJD method, it's 64 (179 versus 115).
| Team 1 score (30 ov) | DLS target | DLS tgt diff | VJD target | VJD tgt diff |
| 90 for 4 | 103 | _ | 100 | _ |
| 140 for 4 | 155 | 52 | 141 | 41 |
| 190 for 4 | 165 | 10 | 172 | 31 |
| 240 for 4 | 182 | 17 | 197 | 25 |
DLS in T20 matches
In 20-over matches, though, the new DLS method has clearly moved towards higher target scores compared to the previous version. The two tables below illustrate that quite clearly. The 10-over targets for totals of around 160 or lower are pretty similar among all three methods, but the targets for scores of 200 or more have gone up considerably in the current method.
| Team 1 score | DLS target | D/L target | VJD target |
| 80 | 48 | 48 | 51 |
| 120 | 72 | 71 | 73 |
| 160 | 94 | 92 | 93 |
| 200 | 114 | 107 | 112 |
| 240 | 133 | 123 | 129 |
In cases when the interruption occurs when the first team is still batting, the difference in targets is even greater: for a ten-over score of 80 for 1, the current DLS target is 106, compared to 97 in the earlier D/L method, while VJD is somewhere in between. For higher scores, the difference in targets between the earlier and current versions is even more.
| Team 1 score(10 ov, 1 wkt) | DLS target | D/L target | VJD target |
| 80 | 106 | 97 | 102 |
| 90 | 115 | 103 | 110 |
| 100 | 124 | 109 | 118 |
| 110 | 132 | 116 | 127 |
| 120 | 140 | 124 | 134 |
The DLS targets appear more consistent in 20-over games than it does in 50-over matches, though even in 20-over matches it possibly tends to over-value the importance of wickets in hand: a score of 50 without loss in seven overs projects into a 20-over total of 174, which reduces to 164 when the team loses one wicket in scoring 50 in seven, and reduces further to 154 when it loses two wickets.
The ICC has adopted the DLS method for all international matches, but some of the examples above suggest there are still areas where the system can improve, and also that there's another method that deserves serious consideration. A closer scrutiny is required to decide either way, but the ICC must invest the time to do so, and then make public the reasons for their decision.
S Rajesh is stats editor of ESPNcricinfo. Follow him on Twitter