The bat-first advantage in IPL 2015
Teams batting first have a 31-23 win-loss record in IPL 2015; last year, they won only 22 games and lost 37
S Rajesh
22-May-2015
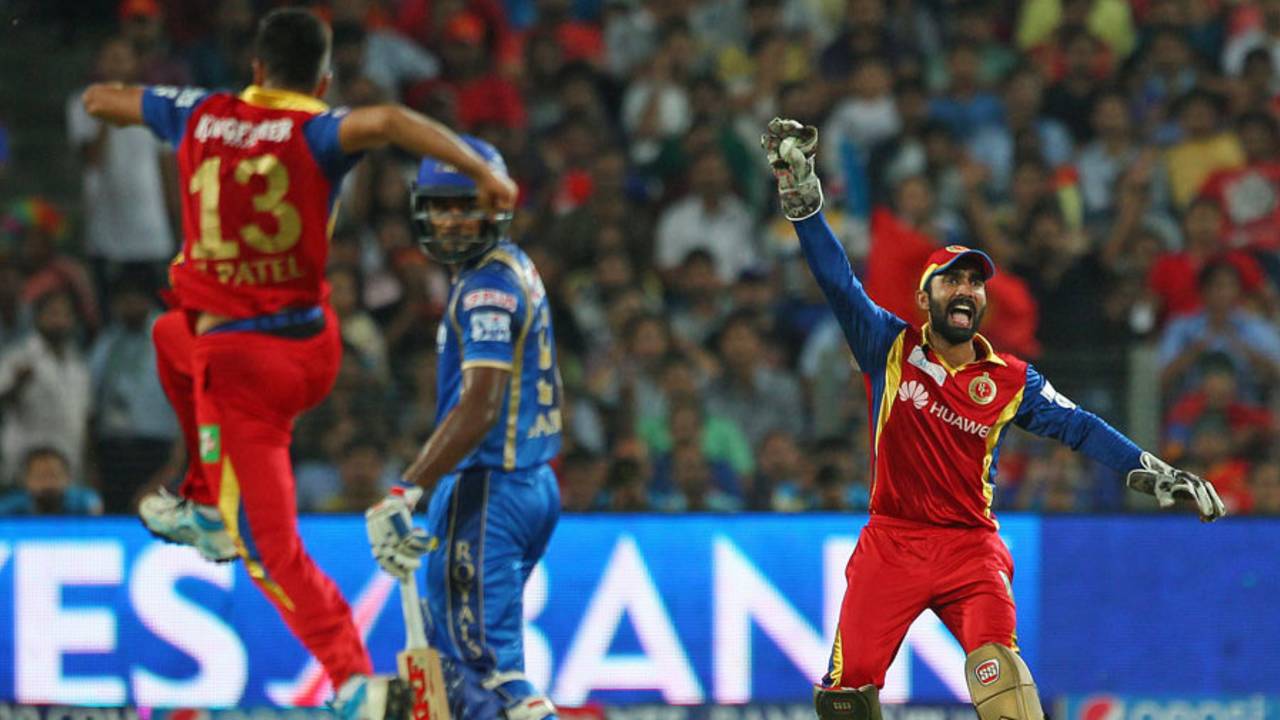
The win for Royal Challengers against Rajasthan Royals in the eliminator was the 31st win for the team batting first in IPL 2015 • BCCI
In 457 completed IPL games before the start of this season, the team chasing had won 248 and lost 204. (Five games were tied in regular time, and decided by the Super Over.) Despite all talk of the advantage of putting runs up on the board, in IPL matches the advantage seemed to rest with teams who knew what they were chasing, and could hence plan their innings accordingly. The advantage was most pronounced in the 2014 IPL, when teams batting second won 37 games and lost only 22 - that win-loss ratio of 1.68 was marginally better than in the inaugural IPL in 2008, when teams chasing had a 36-22 win-loss record. Only once, in any of the previous seven seasons, had the teams chasing won fewer games than they'd lost: in 2010, they won 28 games and lost 31.
In the 2015, though, the teams batting first have hit back with a vengeance, for all the years of misery heaped upon them. So far this season, in 55 completed games, the teams batting first have won 31 times and lost only 23 (one game was tied). The win-loss ratio of 1.35 is easily their best in any IPL season, and more than twice as good as last season, when it was down at 0.59.
What stands out in the table below, which looks at the stats for the team batting first in each IPL season, is their run rate in 2015 - it's 8.53, easily the best among all seasons; the next-best is 8.25 in 2010. The run rate for the teams chasing in 2015 is 8.21, which is the second-best among all seasons - the best is 8.39 in 2008 - despite the poor record for teams chasing this year. With such high run rates being achieved by teams batting first and teams chasing, it's not surprising that the overall run rate in the 2015 IPL so far, of 8.38, is also the highest, sneaking past 2008's 8.30, and 2014's 8.20.
| Teams | Matches | Won | Lost | W/L ratio | Ave | RPO |
| 2008 | 58 | 22 | 36 | 0.61 | 23.75 | 8.23 |
| 2009 | 57 | 26 | 30 | 0.87 | 23.27 | 7.58 |
| 2010 | 60 | 31 | 28 | 1.11 | 26.94 | 8.25 |
| 2011 | 73 | 32 | 40 | 0.80 | 25.98 | 7.78 |
| 2012 | 74 | 34 | 40 | 0.85 | 27.11 | 7.93 |
| 2013 | 76 | 37 | 37 | 1.00 | 26.50 | 7.86 |
| 2014 | 60 | 22 | 37 | 0.59 | 27.79 | 8.22 |
| 2015 | 57 | 31 | 23 | 1.35 | 28.86 | 8.53 |
The table below shows that teams batting first have done better in every score range this season. Even when scoring less than 160, they've won one in every three games. (This includes the shortened games where, also, they've won one out of three.)
The big difference in this tournament, though, is when teams have scored 190 or more batting first: no team has successfully chased down a 190-plus target. There was a tie, though, when Kings XI Punjab leveled Rajasthan Royals' 191 and eventually won the Super Over to hand Royals their first defeat in their sixth match this season. However, other than that, there have been nine wins for teams batting first when they've scored 190 or more, and a washout, when Royal Challengers Bangalore scored 200 against Royals in Bangalore.
The highest target successfully chased down this season so far is 185, by Royals against Delhi Daredevils (and that win came off the last ball of the innings). In 2014, there were seven scores of 185 or more that were successfully chased down; in fact there were two instances of 206 being chased down by Kings XI, against Chennai Super Kings, and Sunrisers Hyderabad. Kings XI also won when chasing 192 against Royals, and in each of those three chases Glenn Maxwell made significant contributions. His wretched form this season - 145 runs in 11 innings, compared to 552 in 16 innings in 2014 - has probably been a significant reason for a drop in numbers for the chasing teams.
| 2015 | 2014 | |||||
| Score range | No. inngs | Wins | Losses | No. inngs | Wins | Losses |
| Below 160 | 21 | 7 | 14 | 28 | 5 | 22 |
| 160-169 | 9 | 4 | 5 | 8 | 2 | 6 |
| 170-179 | 6 | 5 | 1 | 8 | 6 | 2 |
| 180-189 | 10 | 6 | 3 | 5 | 3 | 2 |
| 190 and above | 11 | 9 | 0 | 11 | 6 | 5 |
Despite results favouring teams which have batted first in this IPL, captains have fielded after winning the toss more often than they've batted first. Teams fielding first after winning the toss have a 12-17 win-loss record this year; in the 2014 IPL they lost as many, but won twice the number they have this year.
| 2015 | 2014 | |||||
| Matches | Won | Lost | Matches | Won | Lost | |
| Won toss and batted | 25 | 14 | 11 | 19 | 5 | 13 |
| Won toss and fielded | 32 | 12 | 17 | 41 | 24 | 17 |
The 2015 World Cup also favoured teams batting first and racking up huge scores, but in the World Cup, teams batting first scored many more runs in the last one-third of their innings (last 15 overs) than the teams chasing managed in the same part of their innings. There's no such skew in the IPL - teams batting first have averaged 10.56 runs per over in the last five overs, compared to 9.99 by the team chasing, which is a difference of about 5%.
Overall, teams have averaged 51.58 runs in the last five overs this year, compared to 50.56 last year, and 48.30 in 2013. Those five-over rates aren't too different from the rates at which the overall scoring patterns have increased.
The difference this year, though, has dominance of the team batting first in the winning column. The first qualifier and the eliminator were both won - quite handily - by the teams which set the target, and captains winning the toss might go the same route in the last two games of the tournament as well.
| Over No. | Run rate - 2015 | Run rate - 2014 | Run rate - 2013 |
| 1 | 5.98 | 6.45 | 5.16 |
| 2 | 7.47 | 6.35 | 6.55 |
| 3 | 8.77 | 7.67 | 7.2 |
| 4 | 8.74 | 8.35 | 7.02 |
| 5 | 8.07 | 8.03 | 7.78 |
| 6 | 7.78 | 8.42 | 7.84 |
| 7 | 7.07 | 6.99 | 6.44 |
| 8 | 6.94 | 6.89 | 6.78 |
| 9 | 7.64 | 6.97 | 7.06 |
| 10 | 7.79 | 7.23 | 6.77 |
| 11 | 7.48 | 8.39 | 7.48 |
| 12 | 8.22 | 8.31 | 7.12 |
| 13 | 8.11 | 8.39 | 7.57 |
| 14 | 8.71 | 7.82 | 7.93 |
| 15 | 8.67 | 8.68 | 8 |
| 16 | 9.8 | 9.29 | 8.43 |
| 17 | 10.68 | 9.31 | 9.34 |
| 18 | 10.09 | 10.16 | 9.51 |
| 19 | 10.76 | 10.34 | 9.76 |
| 20 | 10.25 | 11.46 | 11.26 |
| Overall | 8.38 | 8.20 | 7.67 |
S Rajesh is stats editor of ESPNcricinfo. Follow him on Twitter