Dot balls, singles, twos and boundaries
We analyse teams, batsmen and bowlers on these parameters in the 2011 World Cup
S Rajesh
08-Apr-2011
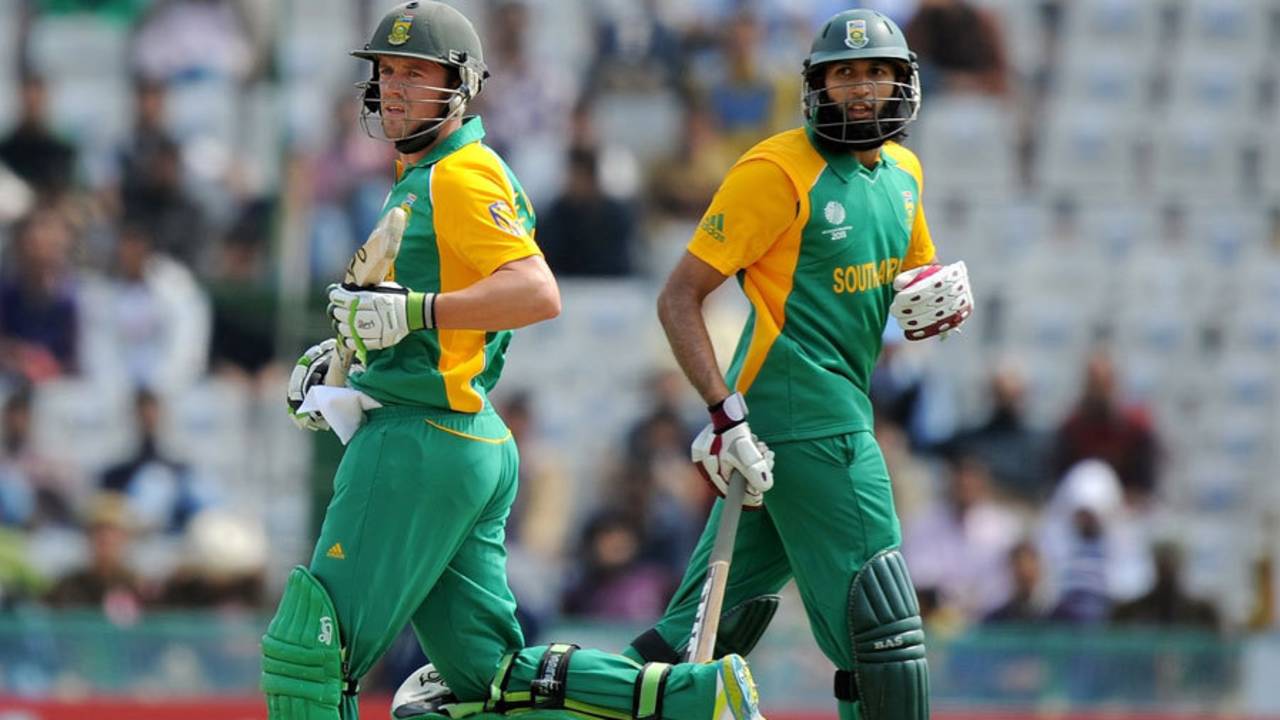
AB de Villiers and Hashim Amla were among the batsmen who played the lowest percentage of dot balls • AFP
Almost a week after a heady tournament came to its culmination, it's time to look back at some of the vital stats that defined the performances of the teams. Three of the key measures for batsmen and bowlers are the dot balls bowled and faced (they indicate the amount of pressure a team put themselves under or exerted on the opposition), the singles and twos taken and conceded, which are a measure or urgency in the batting and in the field; and the boundaries scored and given away, which indicate a batting line-up's explosive ability and a bowling unit's ability to contain it.
Overall in the 2011 World Cup, the number of dot balls bowled was about three percentage points less than in the previous World Cup, the number of singles and twos increased by a similar number of percentage points, while the percentage of runs scored in boundaries increased a bit too. The overall numbers were obviously affected by the fact that the 2011 World Cup was held in three countries and the conditions were different in each - India was much more batting-friendly compared to Sri Lanka and Bangladesh.
The overall stats also show how the top eight teams fared on these parameters. India's batting strength clearly shows through in these numbers: historically their batsmen have been known to rely more on boundaries than singles and twos, which also generally translates into a relatively high dot-ball percentage. However, the presence of Gautam Gambhir, Virat Kohli, Yuvraj Singh, MS Dhoni and Suresh Raina in the current line-up means they are now among the best at running singles and twos, and at minimising dot balls. That's clear from the table below, where India's dot percentage of 47.99 is only marginally poorer than England's, who were the best team in this aspect in the tournament, and better than South Africa. These were also the only teams with a sub-50% dot-ball rate.
The other aspect that stands out about India's batting is that their batsmen were explosive enough to find the boundaries fairly often - 45% of their runs were scored in fours and sixes, which is a healthy percentage. England's dot-ball percent was low, but then so was their boundary ratio, which meant they couldn't always get the sort of scores they needed to, despite playing relatively few dot balls.
West Indies, on the other hand, were a side that believed in fours, sixes, and little else. They struck 33 sixes, which was the second-highest after New Zealand's 36, but they also played out the highest percentage of dots among the top eight teams, and had the smallest percentage of singles and twos. Theirs was clearly a high-risk strategy, and it didn't quite pay off.
| Batting team | Total runs | Total balls | Dot-ball % | 1s and 2s % as % of balls faced | 4s and 6s as % of runs scored |
| India | 2471 | 2557 | 47.99 | 41.30 | 45.08 |
| Sri Lanka | 2207 | 2333 | 50.19 | 38.62 | 46.04 |
| Pakistan | 1656 | 1983 | 55.82 | 34.80 | 40.70 |
| New Zealand | 1695 | 1923 | 54.60 | 35.41 | 46.02 |
| South Africa | 1767 | 2001 | 48.28 | 42.88 | 39.05 |
| Australia | 1441 | 1593 | 50.85 | 39.55 | 42.33 |
| England | 1829 | 2056 | 47.47 | 44.41 | 35.10 |
| West Indies | 1411 | 1746 | 58.36 | 32.76 | 47.48 |
| All teams | 21,333 | 25,423 | 54.86 | 36.01 | 42.97 |
| All teams - 2007 World Cup | 21,333 | 25,851 | 57.92 | 33.01 | 44.47 |
The bowling presents a slightly different picture. India weren't as dominant with ball as they were with bat, but in the knockout games they rose to the occasion spectacularly. Their dot-ball percentage was the lowest among the top eight teams, and though they conceded a higher percentage of singles and twos than any other side, they didn't give away as many runs in fours and sixes on average as some of the other sides did. India conceded 183 fours, which was the highest in the tournament, but they also bowled 487 deliveries - that's 81.1 overs - more than any other side.
The teams with the best bowling stats were Pakistan and South Africa: both had dot-ball percentages of around 60, which means they were able to consistently exert pressure on the opposition batsmen. They also didn't concede too many singles and twos, thus forcing batsmen to take more risks. The team that conceded the smallest percentage of runs in boundaries, though, were Sri Lanka - they conceded only nine sixes, which was the second-lowest in the tournament, despite bowling in eight innings.
| Bowling team | Total runs conceded | Ball bowled | Dot-ball % | 1s and 2s as % of balls bowled | 4s and 6s as % of runs conceded |
| India | 2270 | 2622 | 50.34 | 41.30 | 39.91 |
| Sri Lanka | 1605 | 2110 | 55.88 | 36.87 | 35.02 |
| Pakistan | 1517 | 2135 | 61.97 | 30.82 | 39.68 |
| New Zealand | 1548 | 2022 | 59.25 | 32.34 | 43.80 |
| South Africa | 1249 | 1728 | 60.30 | 32.18 | 40.83 |
| Australia | 1437 | 1852 | 59.13 | 32.40 | 43.15 |
| England | 1807 | 1979 | 55.48 | 33.65 | 47.81 |
| West Indies | 1251 | 1565 | 54.89 | 36.55 | 41.57 |
Among the batsmen who played at least 300 balls in the World Cup, AB de Villiers played the lowest percentage of dot balls. In the 326 balls he faced, there were only 122 off which de Villiers didn't score a run, which converts into an exceptionally low percentage of 37.42. The break-up of the balls he faced reads thus: 146 singles, 19 twos, one three, 31 fours and seven sixes. No other batsman comes close to de Villiers' dot percentage: the next best is Mahela Jayawardene with 40.46. Virender Sehwag's low percent is especially noteworthy since he opens the innings and bats during a period when batsmen are more likely to play dots due to the field restrictions.
Among the nine batsmen who have a dot percent of less than 50, the one with the lowest run-rate is Ian Bell, who didn't score off only 136 out of 307 balls, but also didn't strike too many boundaries. His break-up reads thus: 137 singles, 16 twos, 16 fours and two sixes. From the nine top teams, the batsmen who played the most dots were Brad Haddin (58.67) and Graeme Smith (58.33), two naturally aggressive players who changed their gameplan - with varying degrees of success - to suit the slow pitches of the subcontinent.
| Batsman | Runs | Balls | Run rate | Dot ball% |
| AB de Villiers | 353 | 326 | 6.49 | 37.42 |
| Mahela Jayawardene | 304 | 304 | 6.00 | 40.46 |
| Virender Sehwag | 380 | 310 | 7.35 | 42.90 |
| Ian Bell | 245 | 307 | 4.78 | 44.30 |
| Jonathan Trott | 422 | 522 | 4.85 | 44.44 |
| Hashim Amla | 306 | 349 | 5.26 | 44.70 |
| Gautam Gambhir | 393 | 462 | 5.10 | 45.24 |
| Virat Kohli | 282 | 343 | 4.93 | 46.94 |
| Andrew Strauss | 334 | 357 | 5.61 | 47.06 |
Among the bowlers, two Australians head the list for the highest percentage of dot balls bowled. Most players on the list are those who bowled with the new ball during the fielding restrictions, but Mitchell Johnson, who usually bowled first-change, leads with a dot-ball percentage of more than 68. The impressive Tim Southee comes in third, while the only two spinners with a percent of more than 60 are Mohammad Hafeez and Graeme Swann.
| Bowler | Balls | Runs | Econ rate | Dot % |
| Mitchell Johnson | 345 | 231 | 4.01 | 68.41 |
| Brett Lee | 326 | 235 | 4.32 | 66.56 |
| Tim Southee | 434 | 312 | 4.31 | 64.98 |
| Umar Gul | 363 | 272 | 4.49 | 64.74 |
| Shaun Tait | 312 | 264 | 5.07 | 63.14 |
| Mohammad Hafeez | 330 | 193 | 3.50 | 62.12 |
| Graeme Swann | 408 | 309 | 4.54 | 61.27 |
S Rajesh is stats editor of Cricinfo