RESULT
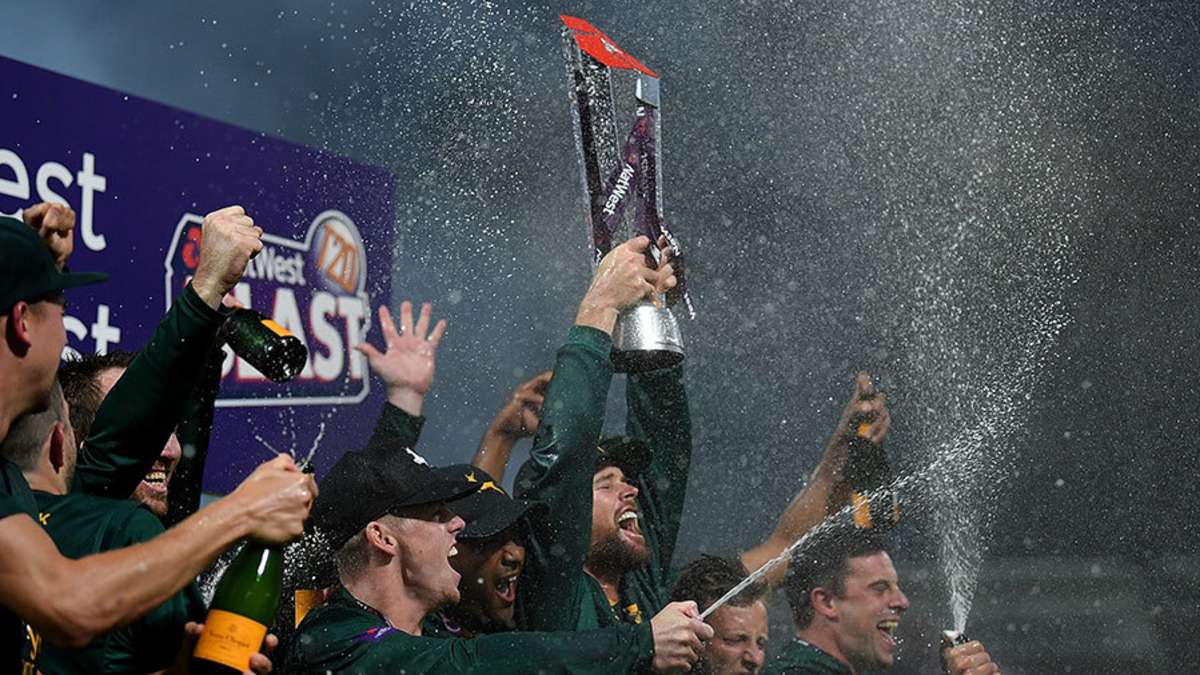
Final (N), Birmingham, September 02, 2017, NatWest t20 Blast
NOT
190/4
WAR
(20 ov, T:191) 168/8
Notts won by 22 runs
RESULT
2nd Semi-Final, Birmingham, September 02, 2017, NatWest t20 Blast
NOT
169/7
HAM
(18.4/20 ov, T:170) 146
Notts won by 23 runs
RESULT
1st Semi-Final, Birmingham, September 02, 2017, NatWest t20 Blast
WAR
175/9
GLA
(19.4/20 ov, T:176) 164
Warwickshire won by 11 runs
RESULT
4th Quarter-Final, The Oval, August 25, 2017, NatWest t20 Blast
SUR
204/5
WAR
(19.2/20 ov, T:205) 207/4
Warwickshire won by 6 wickets (with 4 balls remaining)
RESULT
3rd Quarter-Final, Nottingham, August 24, 2017, NatWest t20 Blast
SOM
151/6
NOT
(18.3/20 ov, T:152) 152/5
Notts won by 5 wickets (with 9 balls remaining)
RESULT
2nd Quarter-Final, Cardiff, August 23, 2017, NatWest t20 Blast
LEI
123
GLA
(13.4/20 ov, T:124) 126/1
Glamorgan won by 9 wickets (with 38 balls remaining)
RESULT
1st Quarter-Final, Hove, August 22, 2017, NatWest t20 Blast
HAM
249/8
DER
(19.5/20 ov, T:250) 148
Hampshire won by 101 runs
RESULT
North Group (N), Nottingham, August 18, 2017, NatWest t20 Blast
LEI
203/5
NOT
(20 ov, T:204) 201/8
Leics won by 2 runs
NO RESULT
North Group (N), Northampton, August 18, 2017, NatWest t20 Blast
DUR
(20 ov) 208/3
NOR
No result
RESULT
North Group (N), Manchester, August 18, 2017, NatWest t20 Blast
LAN
163/4
WAR
(19.3/20 ov, T:164) 169/8
Warwickshire won by 2 wickets (with 3 balls remaining)
Stats & Records
Winner
NatWest t20 Blast 2017 Top Wicket Takers

23
Innings: 12Average: 14.26
22
Innings: 13Average: 19.45
21
Innings: 15Average: 23.80
NatWest t20 Blast 2017 Top Run Scorers
567
Innings: 14Average: 43.61
559
Innings: 16Average: 43.00
542
Innings: 15Average: 38.71
Instant answers to T20 questions