How to be successful in the Champions Trophy? Look to the middle overs
In ODI cricket in 2025, the contest belongs to the team that can maximise batting and bowling efficiency in overs 11 to 40
Kartikeya Date
20-Feb-2025
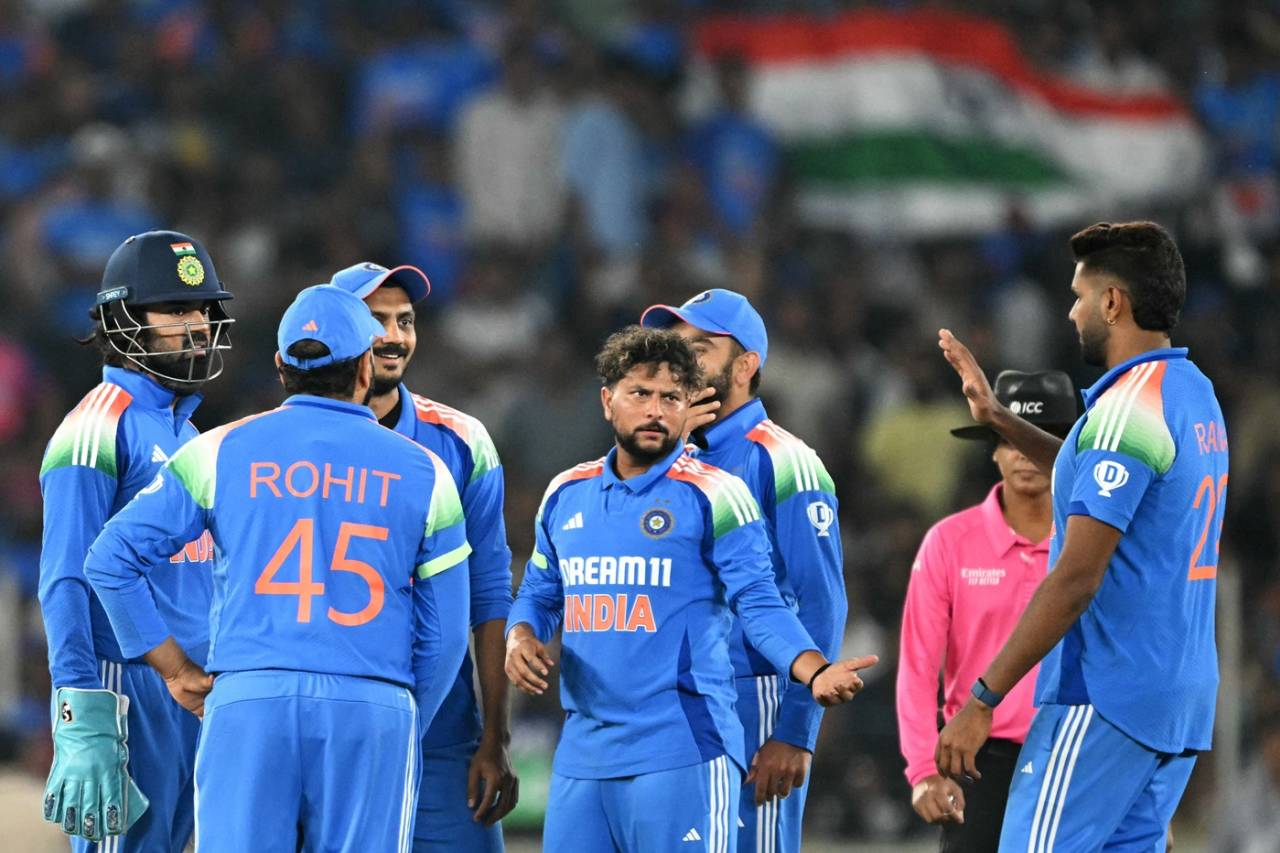
India's strength in ODIs is demonstrated by their scoring 17.2 runs more than they concede in the middle overs and taking 2.2 wickets more than they lose • AFP/Getty Images
One-day international cricket is a contest of efficiency. Normal expectations in ODI cricket have shifted as more matches have been played.
In the 1970s and 80s, ODI openers were staid and their task was understood to be to see off the new ball so that the middle order could build a score against the change bowlers and the older ball. In the 1990s, Saeed Anwar, Mark Greatbatch, Sachin Tendulkar, Sanath Jayasuriya and then Adam Gilchrist demonstrated that the 1980s orthodoxy was inefficient - that the new ball could be plundered for quick runs too.
There was an interesting brief interlude in the early 1990s when it was thought ideal to send the team's best batter to open the ODI innings under the theory that the best batter should face as many deliveries as possible. Inzamam-ul-Haq, Brian Lara and Tendulkar all opened the batting for their teams in ODI cricket at this time. Tendulkar went on to build the greatest opener's record in ODI cricket to date, but Lara and Inzamam soon moved back down the order.
Related

The best teams of their day in ODI cricket are the ones that are most efficient. Efficiency here means that they extract runs more efficiently than the opposition when they bat, and they extract wickets more efficiently when they bowl.
While exploiting the new ball, and power-hitting in the slog overs are well understood, the more significant changes have come in the middle overs of ODI innings. These changes have been shaped to a large extent by the ICC's experiments with the powerplay rule.
The most recent change to the powerplay rules for ODI innings came after the 2015 World Cup, when the authorities decided to relax the restriction of four or fewer fielders outside the 30-yard circle and permit a fifth fielder there after the 40th over. The upshot of these changes can be seen in the chart below.
In the early 2000s, a six was hit once every 150 balls in the middle 30 overs of an ODI innings (overs 11-40). In the early 2020s, a six has been hit once every 60 balls during this period - two and a half times more often. Strikingly, the frequency of fours has not changed significantly. It was a four every 16.4 balls in the early 2000s. It has changed to a four every 15.3 balls in the early 2020s.
Similarly, the scoring rate from deliveries where boundaries are not scored has remained more or less the same. It was 49.9 runs per 100 balls in the early 2000s and is 51.1 runs per 100 balls in the early 2020s.
The change in scoring patterns in the middle overs has been accompanied by more frequent dismissals. In the early 2000s a wicket fell every 49.6 balls in the middle 30 overs of an ODI. In the early 2020s, this figure fell to a wicket every 42.8 balls. The extra fielder in the ring has brought quicker runs and more frequent dismissals in the middle overs.
All this means that much of the action in ODI cricket accelerated. The average successful chase in the early 2000s was 207 runs, while in the early 2020s, it is 232. But even so, the average chase in the early 2020s was completed in 233 balls against the 240 required in the early 2000s. One of the less frequently considered aspects of ODI cricket is that the thrilling chase is the exception and not the norm. Slogging at the death, especially when chasing, is something most teams seek to avoid.
The table below looks at matches since the beginning of 2023 that involve teams that have qualified for the current Champions Trophy. This table provides a fine overview of the relative strengths of the participating teams. Readers should keep in mind that the magnitude of the effect shown in the lower table is exaggerated, since matches rarely last the full 100 overs. Note that the figures are per 180 balls for the middle 30 overs, and per 120 balls for the first ten and last ten overs.